This repo contains codes for solarneergyprediction web application we created with colaboration with nokia You can access the website here (Website might lag sometimes since server will go to sleep after 30 min of inactivity)
- Solar energy is going to play a measure role in the future global energy supply. Due to the fluctuating nature of solar energy, an efficient use is possible depending on reliable forecast information.
- We analyse how the different factors affect the prediction of energy production and how our dataset can be used to predict the expected output of sustainable sources.
- As a result, we facilitate users the necessary information to decide how much they wish to invest according to the desired energy output for their particular location.
- The Training dataset was taken from American Meteorological Society (AMS) 2013-2014 Solar Energy Prediction Contest.
- The dataset is of size 2.84 GB. The data are in netCDF4 files with each file holding the grids for each ensemble member at every time step for a particular variable.
- Each netCDF4 file contains the latitude-longitude grid and time step values as well as metadata listing the full names of each variable and the associated units.
- Each netCDF4 file contains the total data for one of the model variables and are stored in a multidimensional array.
- Weather features were contained in netCDF4 files stored in a multidimensional array.
- NetCDF4 libraries available in R language were used to convert netCDF4 format file for further data cleaning and processing.
- Missing values in time series weather features were replaced using linear and spline interpolation techniques.
- Daily dataset was prepared by averaging over the entire day (for sunlit hours) to represent each data by single data instance.
We have worked onvarious model, Below table shows the R2 score of each models
| Model | R2 Score |
|---|---|
| Linear regression | 0.44 |
| SVR | 0.46 |
| Linear regression on PCA | 0.53 |
| NN with 2 hidden layer | 0.78 |
| Random forest | 0.82 |
| Gradient boosting regressor | 0.82 |
| LightGBM regressor | 0.83 |
| Stack model 1 | 0.83 |
| XGBOOST regressor | 0.84 |
| Stack model 2 | 0.85 |
Note:
- Stack Model 1: Four base estimator and Linear Regressor as Final estimator
- Stack Model 2: Four base estimator and Neural Network with one hidden layer and relu as activation function
- Forecasting in general is the process of making predictions based on past and present data and most commonly by analysis of trends.
- In Machine Learning we Forecast Time series data by training the model on past values. Using the technique we can forecast future data which can be helpful.
- In this project we have forecasted solar energy data by analyzing past solar energy values.
- We use LSTM i.e., Long short term memory. It is a type of RNN but it solves many drawbacks which RNN has.
import requests
baseUrl = 'https://solarenergyprediction.herokuapp.com/'
lat = 12.3829
long = 77.2381
endDate='2022-01-15' #The solar output on this data and 30 days of this date will be calculated
output = requests.request('GET',f'https://solarenergyprediction.herokuapp.com/result?lat={lat}&long={long}&endDate={endDate}').json()
output:
{
  "averageSolarEnergyPerHour": "2209.15 kWh",
  "city_name": "Malavalli",
  "co2": "408.69  kg",
  "co2NoOfTree": 19,
  "costsavings": "\u20b9 12658.43 per hour",
  "currTimeprediction": "3441.57 kWh",
  "endDate": "Sat, 15 Jan 2022 00:00:00 GMT",
  "lat": 12.3829,
  "long": 77.2381,
  "solarOutputPerDay": "26509.8  kWh",
  "solarOutputPerhours": [
    0, 0, 0, 0, 0, 0, 276.75130233391724, 469.44954487599443,
    1527.5418123324287, 2148.199140239004, 2675.2511142428234,
    2855.571983795413, 3240.406316005161, 3211.5681006923755,
    3196.7770615502172, 3033.4511481493782, 2371.3516480803573,
    1503.4792105903468, 0, 0, 0, 0, 0, 0
  ],
  "time": [
    0, 1, 2, 3, 4, 5, 6, 7, 8, 9, 10, 11, 12, 13, 14, 15, 16, 17, 18, 19, 20,
    21, 22, 23
  ]
}
lat = 12.3829
long = 77.2381
endDate='2022-01-15'
output = requests.request('GET',f'{baseUrl}monthly?lat={lat}&long={long}&endDate={endDate}').json()
output:
{
  "dates": [
    "2022-01-14",
    "2022-01-12",
    "2022-01-10",
    "2022-01-08",
    "2022-01-06",
    "2022-01-04",
    "2022-01-02",
    "2021-12-31",
    "2021-12-29",
    "2021-12-27",
    "2021-12-25",
    "2021-12-23",
    "2021-12-21",
    "2021-12-19",
    "2021-12-17"
  ],
  "result": [
    "14815.907",
    "16921.146",
    "16769.104",
    "16976.982",
    "14946.33",
    "18010.521",
    "12812.597",
    "7047.4756",
    "9709.488",
    "29401.314",
    "30484.164",
    "27320.553",
    "12084.217",
    "9187.582",
    "10266.709"
  ]
}
forCastedValueInFloat=[14755.659,14211.258,16711.766,13998.961,14627.025,13725.157,8885.549,9977.241,13007.436,26255.236]
 fetch('https://fastapiforecast.herokuapp.com/getForecast', {
        method: 'POST',
        headers: {
          'Content-Type': 'application/json'
        },
        body: JSON.stringify({
          'tenDaysOutputs': forCastedValueInFloat
        })
      }).then(data => cosole.log(data.json()))
output :
{"next3DaysOutput":[13032.21,14381.95,14743.67]}
- We developed a web application to help the user to utilize our machine learning model and predict the total solar energy generation at a particular location, if they want to set up a solar energy plant.
- Web application is deployed on Heroku: Cloud Application Platform
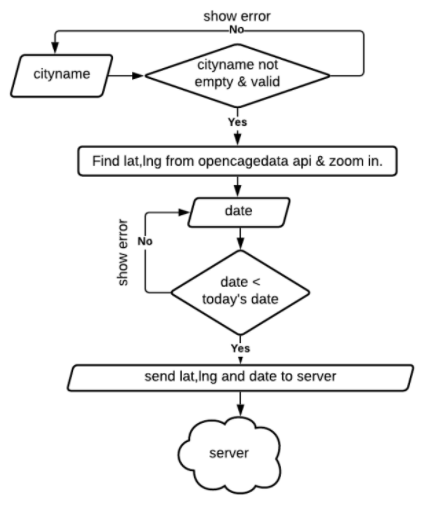
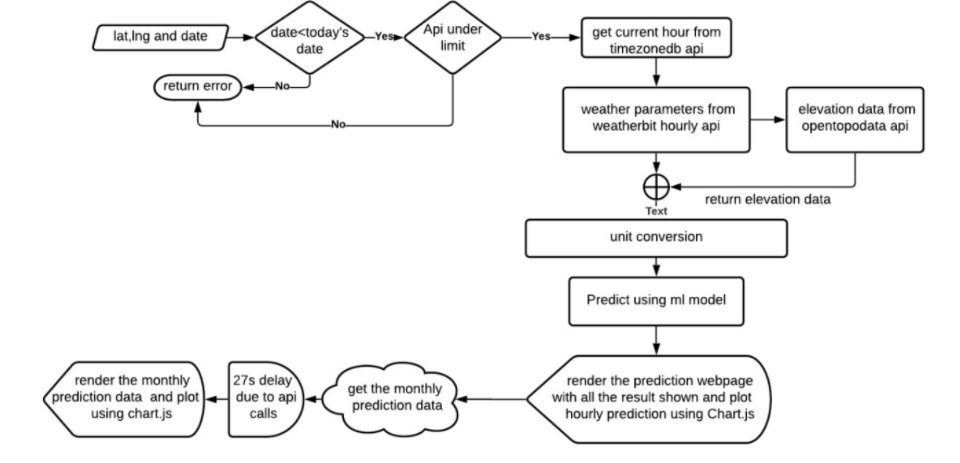
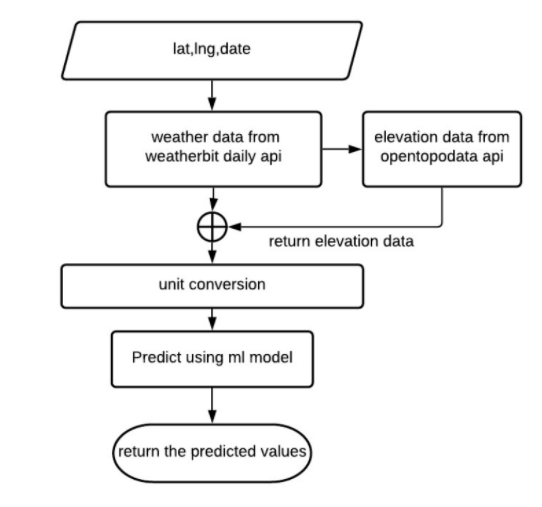
- Weatherbit: Weatherbit API is used to retrieve current weather observations from over 47,000 live weather stations. We provide the city name, from which the latitude and longitude is retrieved and used in the API, and the API provides the weather information required.
- Opentopodata: It is an elevation API, which is used for the “Altimeter” feature.The elevation is provided using the city name or the latitude and longitude.
- Timezonedb: To get time in given latitude and longitude.
- Opencagedata: The OpenCage Geocoding API provides reverse (lat/long to text) and forward (text to lat/long) geocoding via a RESTful API.
- Model will aid users for solar Power forecasting at any particular location in making practical design decisions.
- This forecasting approach is a key step towards the development of a data-driven decision-making framework for power system operation.
- Similar study and conclusion can be drawn on large scale national solar grid and wind farms’ energy forecasting models.
|   LICENSE
|   README.md
|
+---Dataset
|       .~lock.hourly-dataset_commit24.xlsx#
|       .~lock.hourly-dataset_final.xlsx#
|       daily.csv
|       hourly-dataset_final.xlsx
|       hourly-dataset_without-night-hrs.xlsx
|       README.md
|
+---data_preprocessing
|       cor_analysis.R
|       daily-weather-dataset_chronological-order.xlsx
|       solar-output_daily.csv
|
+---Forecasting
|       .gitkeep
|       Solar_energy_forecasting.ipynb
|
+---Model Building
|       Basic_Neural_networks.ipynb
|       Dim_Reduction_PCA.ipynb
|       hourly-dataset_final.xlsx
|       lightGBM MAE401.324971 R20.825761.pkl
|       Multiple_Regression.ipynb
|       Neural Networks.ipynb
|       README.md
|       Workspace.ipynb
|       xgb MAE409.912384 R20.836636.pkl
|
+---slides and report
|       ML_Nokia_Final_report_Team5.pdf
|       slide.pdf
|
\---webapplication
    |   .gitignore
    |   app.py
    |   environment.yml
    |   gbr1.pkl
    |   mainpage.py
    |   monthly.py
    |   perday.py
    |   Procfile
    |   README.md
    |   requirements.txt
    |   utils.py
    |   xgb_r_sklearn.txt
    |
    +---forecastFastApi
    |       forecasting_model
    |       main.py
    |       Procfile
    |       requirements.txt
    |
    +---static
    |   |   world.png
    |   |
    |   +---javascript
    |   |       index.js
    |   |
    |   \---stylesheets
    |           index.css
    |           perday.css
    |
    \---templates
            index.html
            perday.html
Web Application development - Subramanya K ,K Shivanithyanathan
Xgboost, GBR models, and Stacking (Ensembling technique) - Roshan Nayak
Dataset creation and Model Building - Priyanshu M
Forecasting - Venkatesh Subramanya Iyer Giri
Other - Tanay Somnani,K S Eshwar Subramanya Prasad