![]()
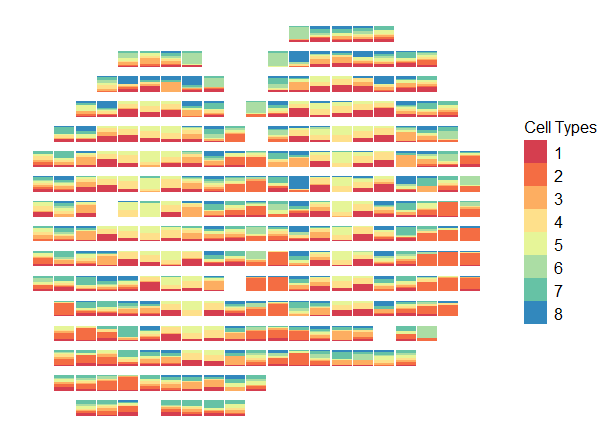
scatterbar is an open-source R package for displaying proportional data across spatially resolved contexts. This is the scatterbar R documentation
website. Questions, suggestions, or problems should be submitted as
GitHub issues.
![]()
By combining the concepts of scatter plots and stacked bar charts,
scatterbar allows users to visualize variations in proportional data
data and compare across different spatial locations.
To install scatterbarfrom GitHub, we recommend using remotes:
require(remotes)
remotes::install_github('JEFworks-Lab/scatterbar')- Customizing Scatterbar
- Getting Started With Scatterbar
- Using Scatterbar With
SpatialExperiment - Using Scatterbar With Visium Files
- Visualizing Multiple Datasets
- Flipping Scatterbar Oreintations
Our paper describing scatterbar is available on Oxford Bioinformatics: