This project utilises different data points from 4,114 fundraises from 2009 through 2017 that were held in KickStarter, a popular crowdfunding company. The main data points that were used include the goal, outcome, launch day, category and sub-category. Using that, it is possible to map different outcomes based on the state of multiple variables.
The purpose of analysing the KickStarter data was to assess the likelyhood of successfully fundraising a play as well as helping Louise determine when would be the right time to launch Fever's campaign to have better odds at succeeding.
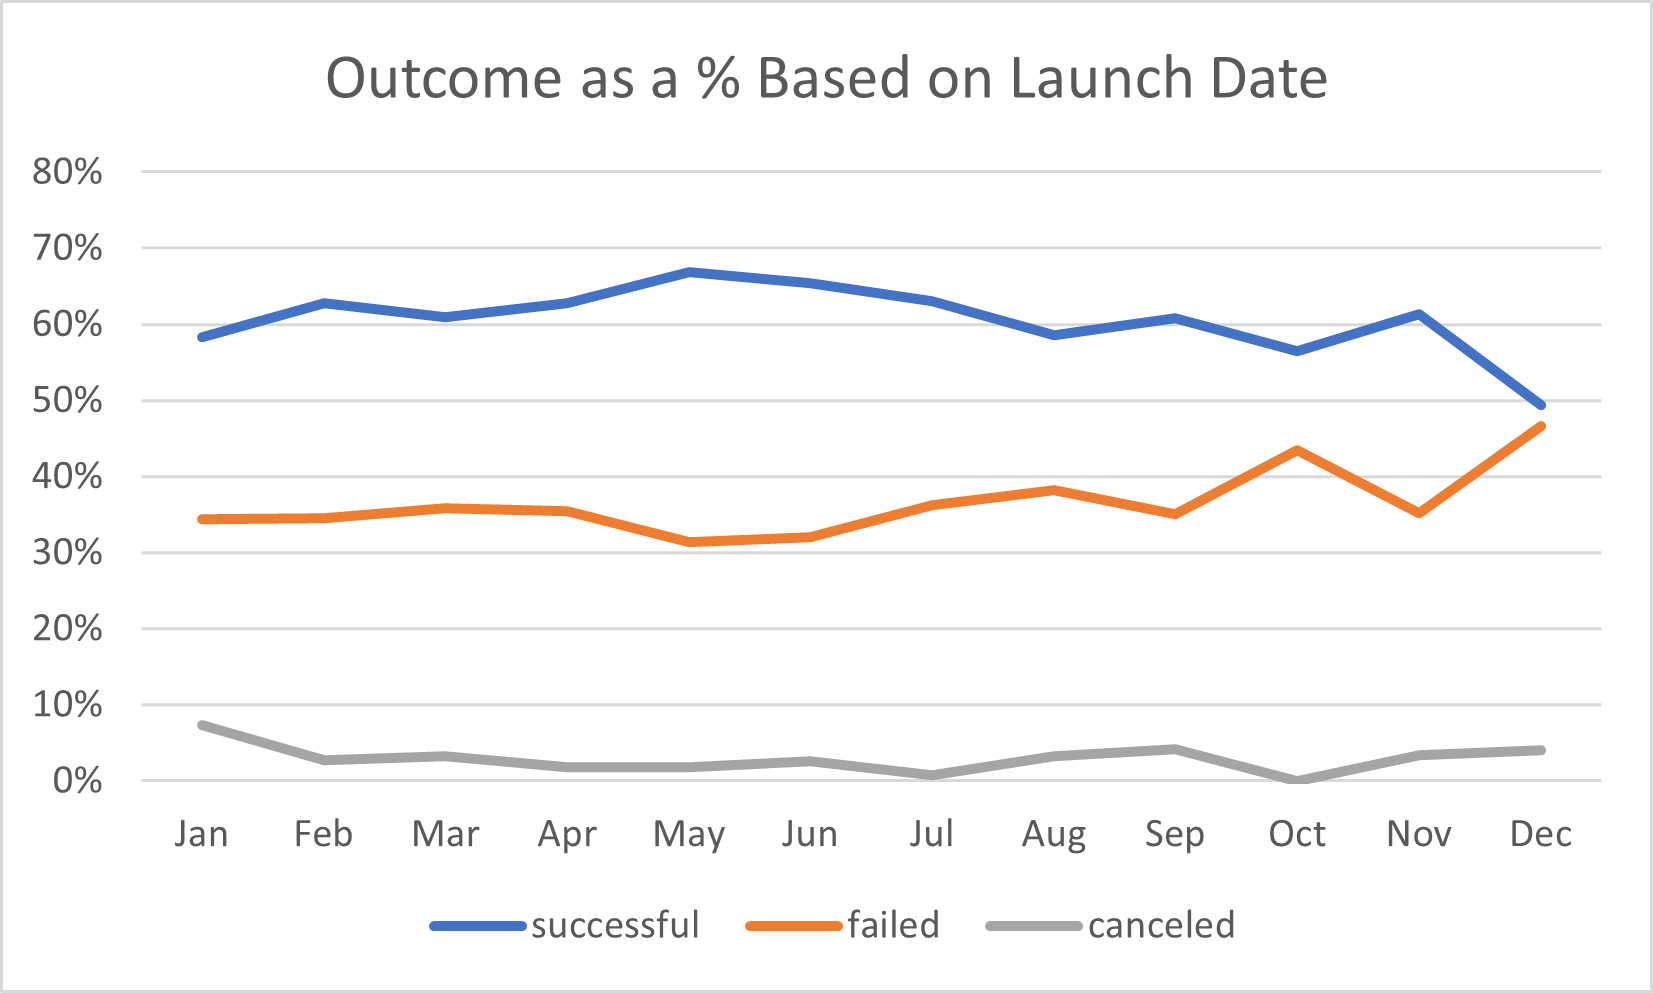
As it can be seen in the next chart (Chart #1), the most amount of successful theater campaigns were launched in May. As for the most amount of failed campains, May also takes the lead. This means tha analysing the results based solely on this may prove unreliable, which is why a new chart was plotted (Chart #2). This new chart, rather than using the number of projects as the y-axis, it uses percentage to map the proportion of projects by outcome in relation to the total amount of projects. Chart #2 paints a better picture of the situation. It affirms that May is indeed the right month to launch due to the fact that it has the highest percentage of successful campaigns with roughly 67%. This is opposed to what has historically happened in Decemeber, when theater campaigns have failed 47% of the time.
Chart #1
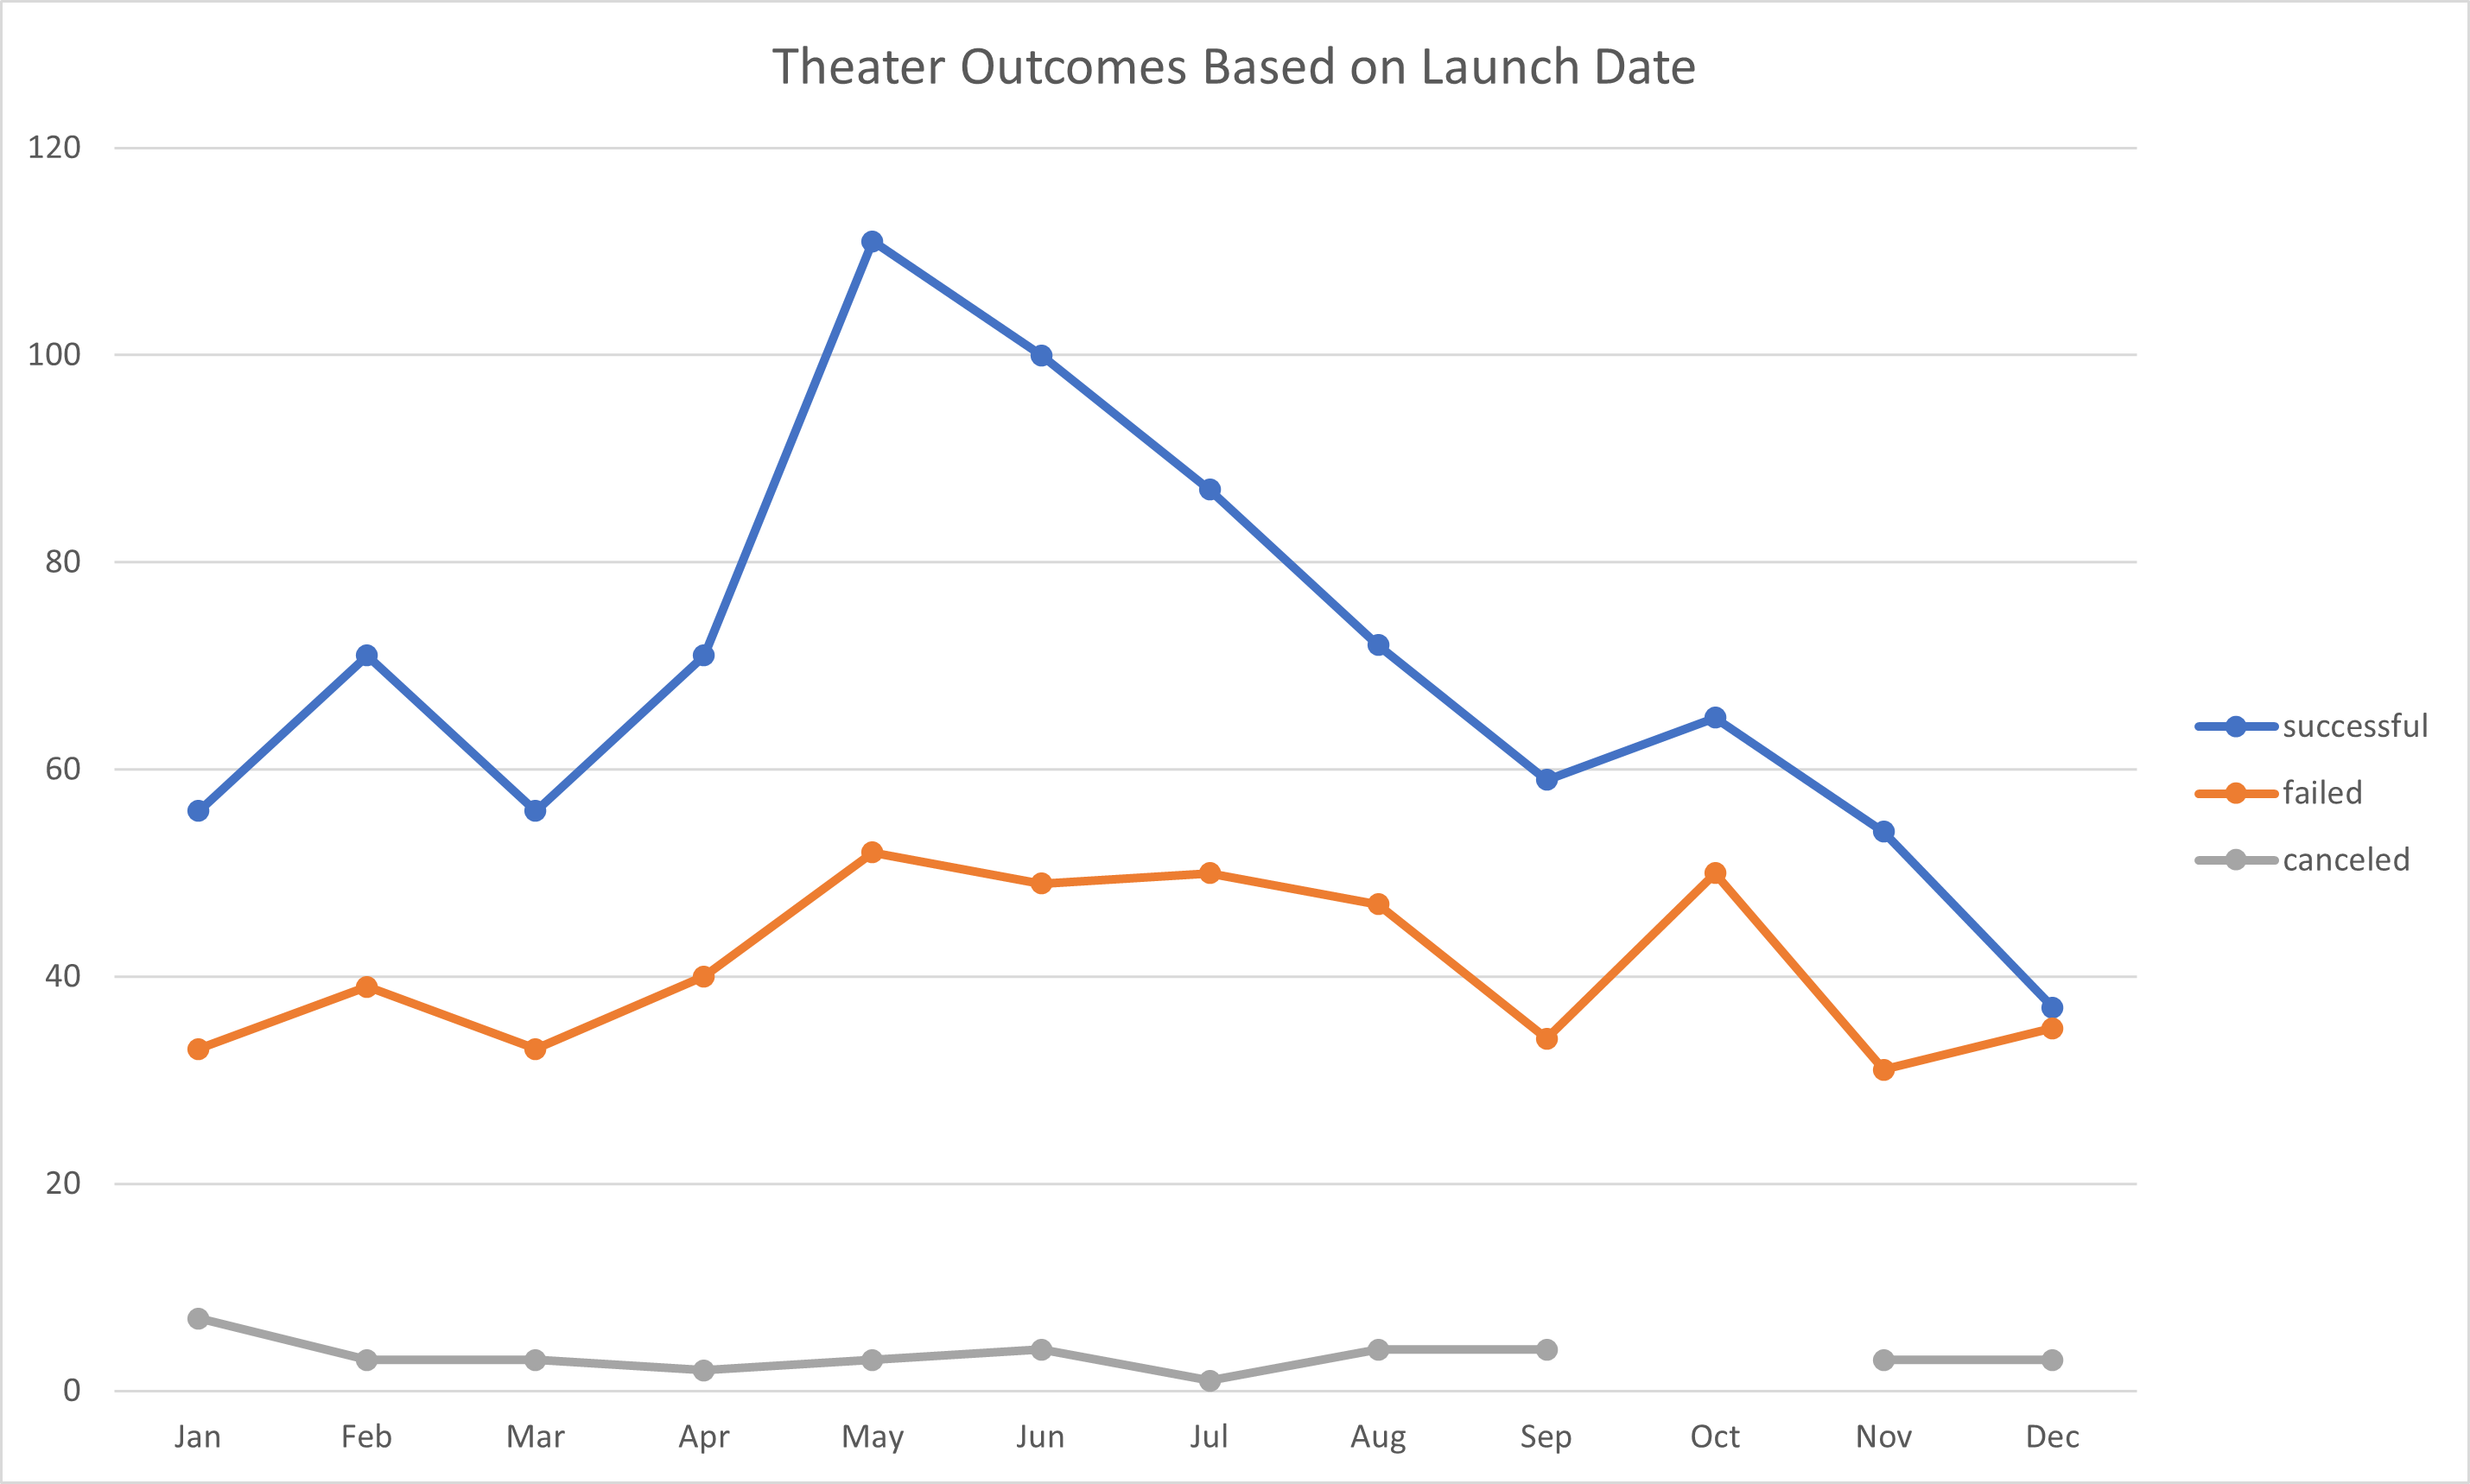
Chart #2
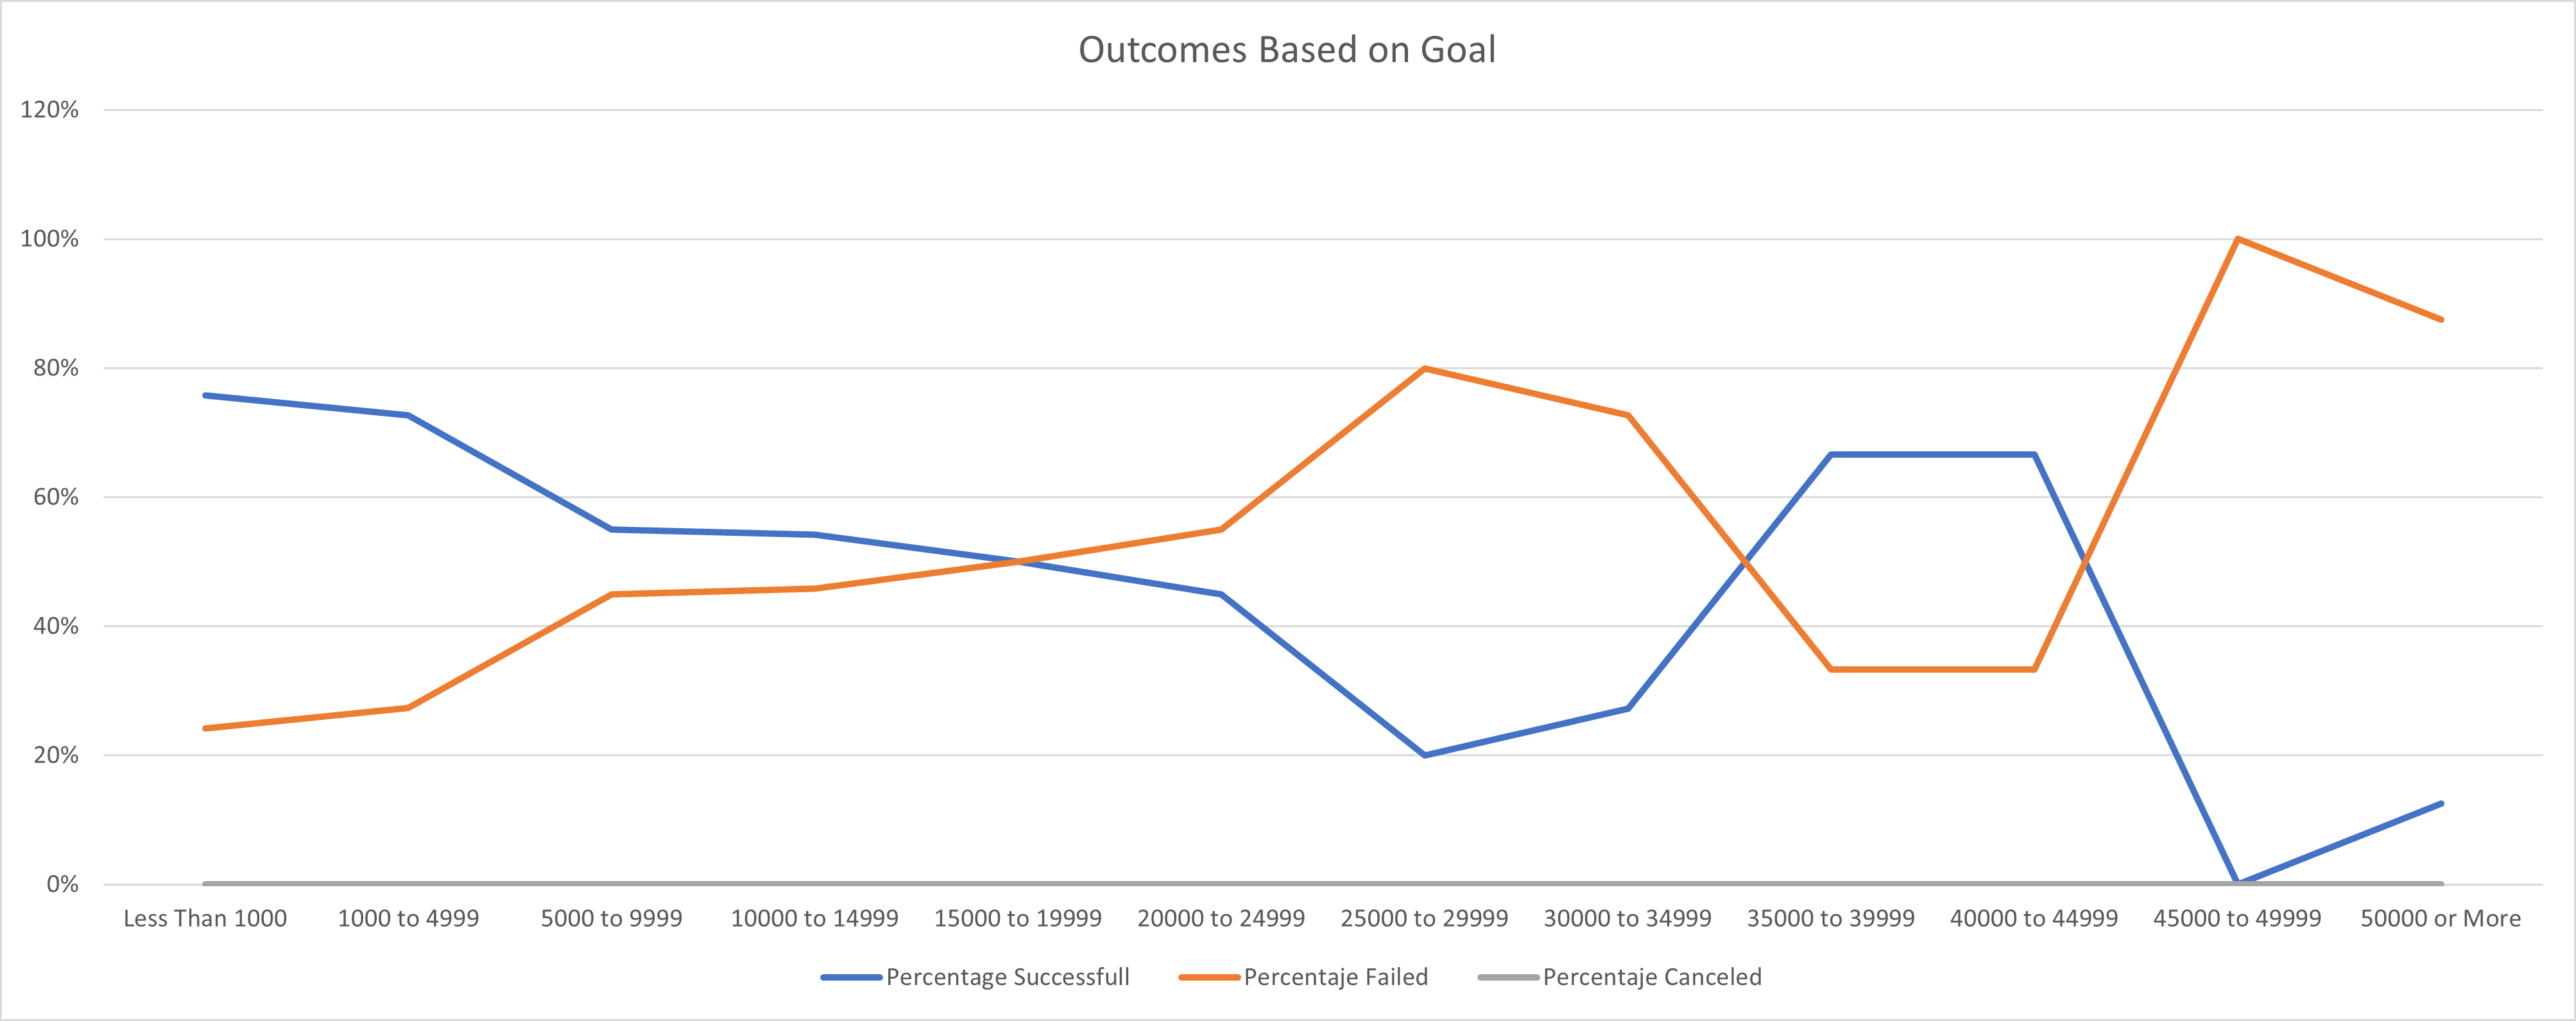
The next chart (Chart #3) plots the outcomes based on the fundraising goal. It can be clearly seen that there is, for most part, an inverse correlation with goal and success of the campaign. This means that the higher the goal, the more likely it is that the campaign will fail. Nevertheless, there is a quite notable exception with projects that have goals between $35,000 and $45,000.
Chart #3
The main challenge for the Outcomes based on launch date analysis is presented when remembering that correlation does not mean causation. There is a visible trend; however,
this does not necessarily mean that it will remain constant in the future.
As for the outcomes based on goals analysis, the challenge arises from the fact that the inverse correlation trend between goal and success is partially broken in the
$35,000 to $45,000 range. This could be for a variety of reasons that have to be studied before reaching a conclusive answer. There could be various hypotheses for this
fact, such as the fact that previusly funded projects might have fundraised for a second time and thus it was more likely to be funded a second time. It could
also be that more prominent people have asked for more money and it was easier for them to get funded. However; this further analysis is outside the scope of the collected
data.
-
What are two conclusions you can draw about the Outcomes based on Launch Date?
- May is the best month to launch since 67% of campaigns launched on that month were successful and only 31% were failed.
- Decemeber is the riskiest motnh to launch since 49% of campains succeeded while 47% failed.
-
What can you conclude about the Outcomes based on Goals?
- While there is a clear negative correlation between goal and outcome, there seems to be an exception in the range from $35,000 to $45,000. Without any further data, this means the Louise should set a low goal in order to maximize her chances of success.
-
What are some limitations of this dataset?
- The main limitation is that there is no information of who created each campaign and their track record in fundraising. Having this data would greatly help in finding correlations between data points and getting precise answers on important doubts, such as why the outcome based on goal trend breaks on the $35,000 to $45,000 range.
-
What are some other possible tables and/or graphs that we could create?
- Outcome based on whether the campaign was a staff pick
- Outcome based on whether the campaign was spotlighted
- Outcome based on campaign duration
- Outcome based on the number of projects with the same subcategory on the same month and year
- Outcome based on the number of projects in the same country