This Stock Prediction Application leverages Machine Learning techniques, built using Keras and LSTM (Long Short-Term Memory) models, and integrated into a powerful Django backend framework.
The application predicts future stock prices by analyzing:
- 📊 100-day Moving Average
- 📊 200-day Moving Average
These are key technical indicators widely used by traders and financial analysts to make informed investment decisions.
- Python
- Django – Backend framework.
- yfinance - Python library that allows you to download historical market data from Yahoo Finance.
- Keras – A high level API for building and training neural networks.
- LSTM – Recurrent Neural Network (RNN) model for time series prediction.
- Pandas - Pandas is a powerfull open-source library, used for Data Manipulation and and Analysis in python.
- NumPy - NumPy is a python library that can perform mathematical and statistical operations on large numerical data.
- Matplotlib - Matplotlib is a python library, primarily designed to visualise data in the form of charts and plots.
- TensorFlow - Framework for numerical computation and machine learning, provides various tools for building and deploying Deep learning models.
- Miniconda - Used to create environment to install all the required libraries for jupyter notebook.
Important Disclaimer: Understanding my Prediction Approach In this stock prediction portal project, I'm predicting the previous 30% of the data against the test data of the previous 30%, not the next day, next week, or next month’s price, because stock price movements are highly unpredictable and influenced by countless external factors. The model is trained on historical data and aims to identify patterns from the past, which helps to evaluate its performance based on known data rather than making uncertain future predictions. This approach allows us to assess the accuracy of the model in a controlled environment without the risk of inaccurate future forecasts.
- Machine Learning is subset of Artificial Intelligence in which computer learns to predict future events based on the past datasets. Its like teaching patterns to a machine and then it make predictions based on those patterns.
- Youtube recongnises the type/Genre of videos you like the most and shows up in your feed.
- Gmail uses a machine learning model which recogises whether a mail is a spam or not.
When we train a machine with correct input as well as output data is known as Supervised learning. It is like teaching a kid to label an animal as "Cat" while showing an actual Cat and asking that question again next day. Once, enough datasets are fed. Machine is given unknown inputs and based on it's past learning, an ouput is predicted.
This is a type of machine learning in which machine is fed with unlabelled data and recognise patterns/structures on its own. It is like givng a bunch of toys to a kid and he/she himself identifies and seperate Tigers, Cats, Dogs etc. based on their body sructure, eye shape, hairs and size. In real world this learning is more beneficial on industrial and institutional level. Banks can feed all the transactions to the model and identify the fraudulent activities.
This is type of machine learning in which computer learns to make better decisions by recieving rewards or penalty for its actions. It's like Clapping for a kid when he/she stand up and stumbles on its own for the first time and discouraging activities like eating sand and breaking toys. This type of learning is mostly used in Self-Driving Cars.
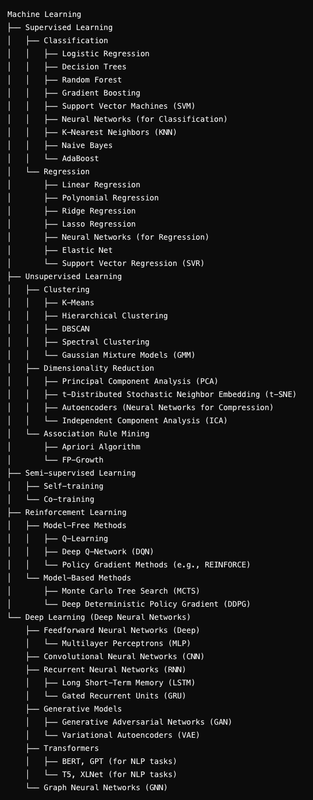
Classification is a type of Supervised learning in which main focus is to predict a label or category based on input data.
Regression is a type of machine learning in which the ultimate goal is to predict continuous numerical values.
- Stock prices change constantly and are influenced by the numerous factors from the past
- Human Emotions can trigger changes in a stock price
- Follows market trends (upwards and downwards)
- ....many other complex factors
So, Classification has nothing to do with our problem resolution. Basic Regression can not produce output datasets considering above conditions. To solve this we introduced an extended version of regression, LSTM (Long Short-Term Memory) model. LSTMs are like regression with built-in memory.
LSTMs can remember and learn from the past events and can predict the stock price. Stock market data is a Time Series data. So, the LSTM are specifically designed for such type of data. Therefore, LSTM is the best fit for this project.
| Machine Learning (ML) | Deep Learning (DL) |
|---|---|
| Collection of tools designed to perform simpler tasks. | Subset of ML, use more complex Algorithm and neural networks. |
| Weather prediction, spam email classification etc. | Sentiment Analysis, Image Recognition and Natural language Processing. |
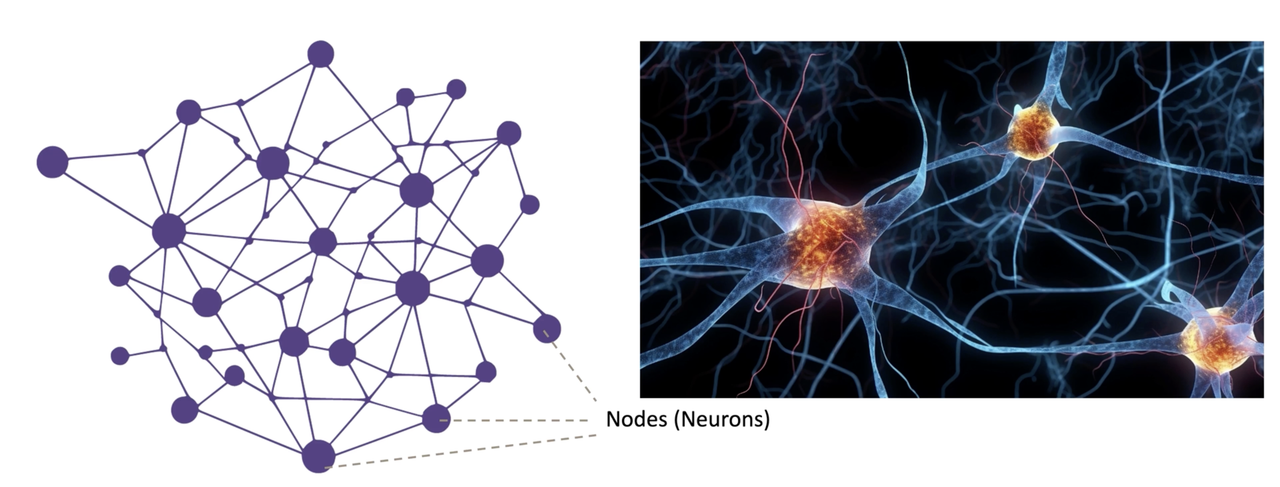
- It is a model which mimics Human brain, Networks are created to recognize patterns and make predictions.
- Neural Network is a set of interconnected nodes (neurons) in which the data is fed to train the model which can travel throughout neighbouring nodes.
Input layer:- Feed data to neural network.
Hidden layers:- Process and Analyze the input data by extracting features and patterns.
Output layer:- Produce the final result, like a prediction or classification.
A Simple neural network have only one hidden layer to process feature and patterns from input data. While, A Deep learning neural network have multiple layers.
- A Real life example is Human brain. During rainy season, whenever their is a cloud formation, the images of the those clouds are captured by human eyes and fed to the brain as input data. That input data is then processed via hidden layers of the neural network of our brain and based upon the past events and patterns, our brain assumes that it is likely to experience a rainfall.
- FeedForward neural networks (FNNs) :- In this neural network, data moves only in one direction i.e. the direction of flow of data doesn't matter. It has no memory. Example: Image Recognition.

- Recurrent neural networks (RNNs) :- RNNs are such type of neural networks in which sequence of data flow matters. It is more sophisticated version of FNNs and has built in short-term memory. Stock market data is time-series i.e. a particular event is tagged with a time and that flow of data matters.

- Convolutional neural networks (CNNs) :- CNNs are mostly used for visual data like images and videos.
Note:- There are two types of RNN. Vanilla RNN and LSTM RNN. The only difference between them is that LSTM model has super powerfull memory capability as compared to Vanilla. It can remember very old events and patterns of a stock, that's why LSTM is the best fit for this project.
- Import the required libraries:
pandas,numpy,matplotlib,yfinance, anddatetime. - Determine the current time.
- Set the end date as the current time
- Set the start date as 10 years before the current time.
- Download historical stock data using
yf.download(ticker, start, end).
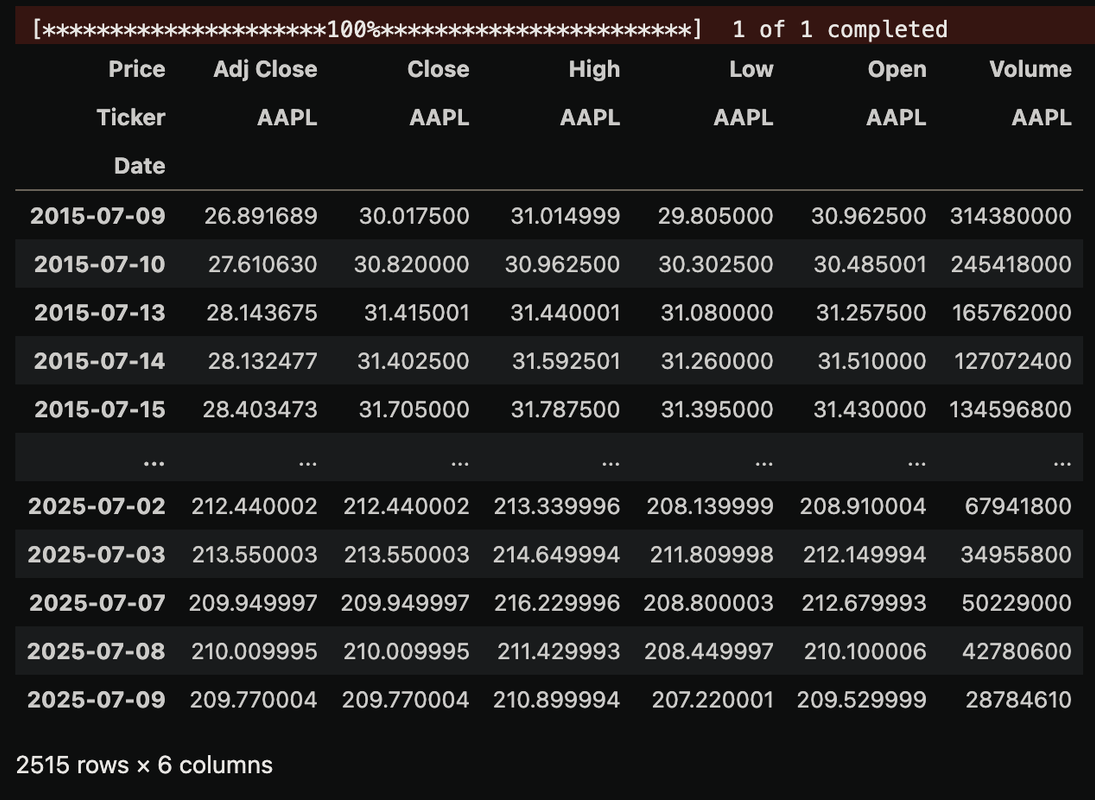
- Used
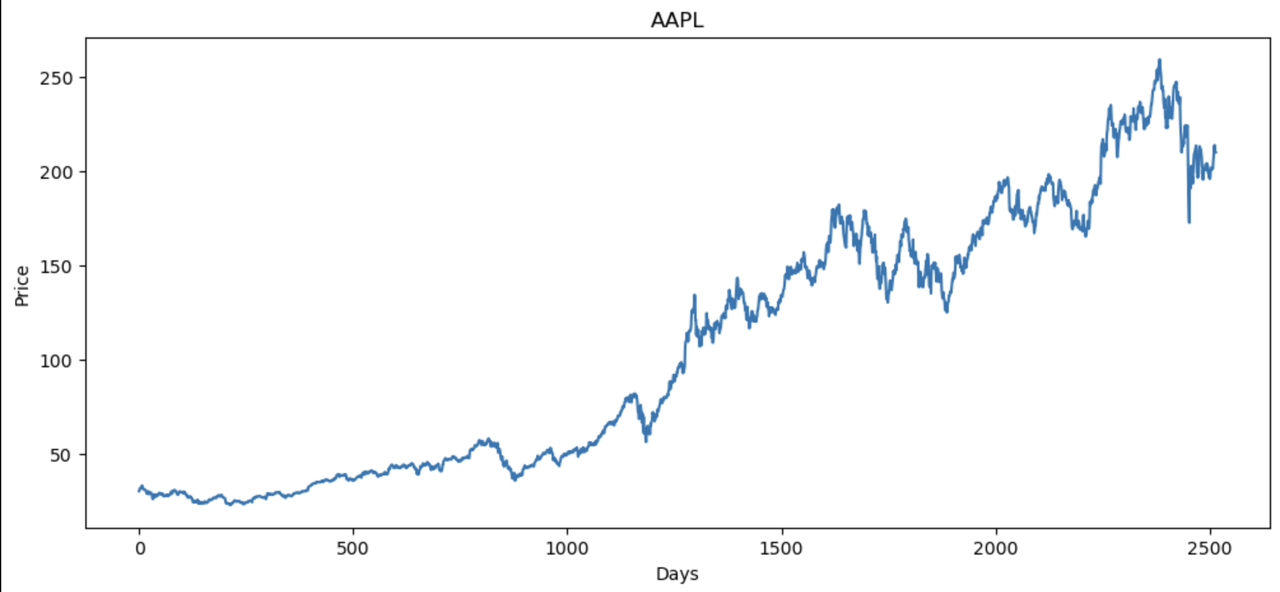
reset_indexto get each day as a separate row with date as a column. - Visualized the stock prices using
plt.plot()from thematplotliblibrary.
- Calculated the 100-day moving average.

- Calculated the 200-day moving average.

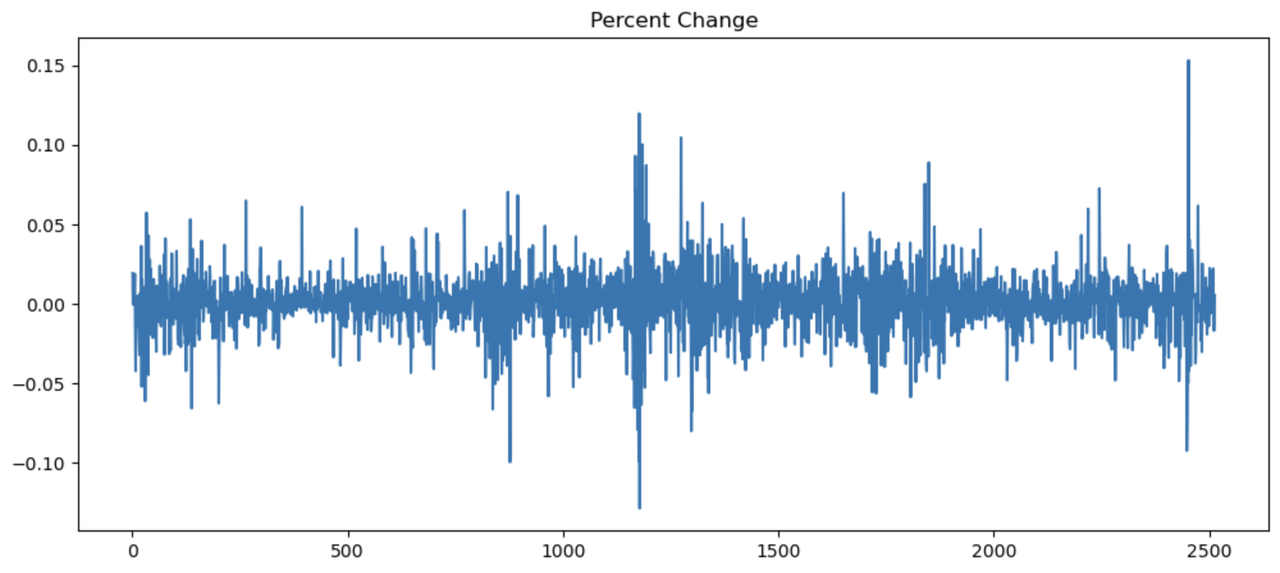
- Computed the percentage change in consecutive day closing prices.
- Scaled down the training data between 0 and 1 using
sklearn. - Scaling down data is essential in machine learning to bring all features to a similar range. Models like LSTM, SVM, and KNN are sensitive to feature magnitudes. Without scaling, larger values (e.g., stock prices or volume) can dominate smaller ones, causing biased learning and unstable training.
Scaling improves:
- Training speed
- Model stability
- Fair contribution from each feature
scaling helps the model learn more effectively and accurately.
- Created
x_trainandy_trainarrays. - Stored sequences of 100 consecutive values from the
data_training_arrayinx_train. - Stored the corresponding result prices in
y_train.
Input Layer (100 timesteps, 1 feature per timestep)
        │
        ▼
LSTM Layer (128 units, tanh activation, return_sequences=True)
        │
        ▼
LSTM Layer (64 units)
        │
        ▼
Dense Layer (25 neurons)
        │
        ▼
Dense Layer (1 neuron - Final Prediction)
- The Input Layer inputs 100 close prices into the network.
- First LSTM layer further process the data fed to the layer and return outputs a sequence of shape(100, 128)
- Second LSTM layer compresses the 128 outputs recieved from the previous layer to 64
- Then this output goes into a Dense layer of 25 neurons which learns the complex patterns.
- Finally the last Dense layer output a single Predicted Stock Price.
- First step is to compile the model and set the optimizer with correct loss function. In this case, I used
adamandmean_squared_error. - Finally, I started the training process taking
x_traindatasets as input andy_trainas output with 50 repetitions.


- Finally, model is saved and used for other stock price predictions.
- Used the same scaling approach and sequence structure as the training data.
- Created test sequences to evaluate model predictions.
- Used
model.predictto generate future stock price predictions. - Applied inverse transformation to convert scaled predictions and actual prices back to original values.
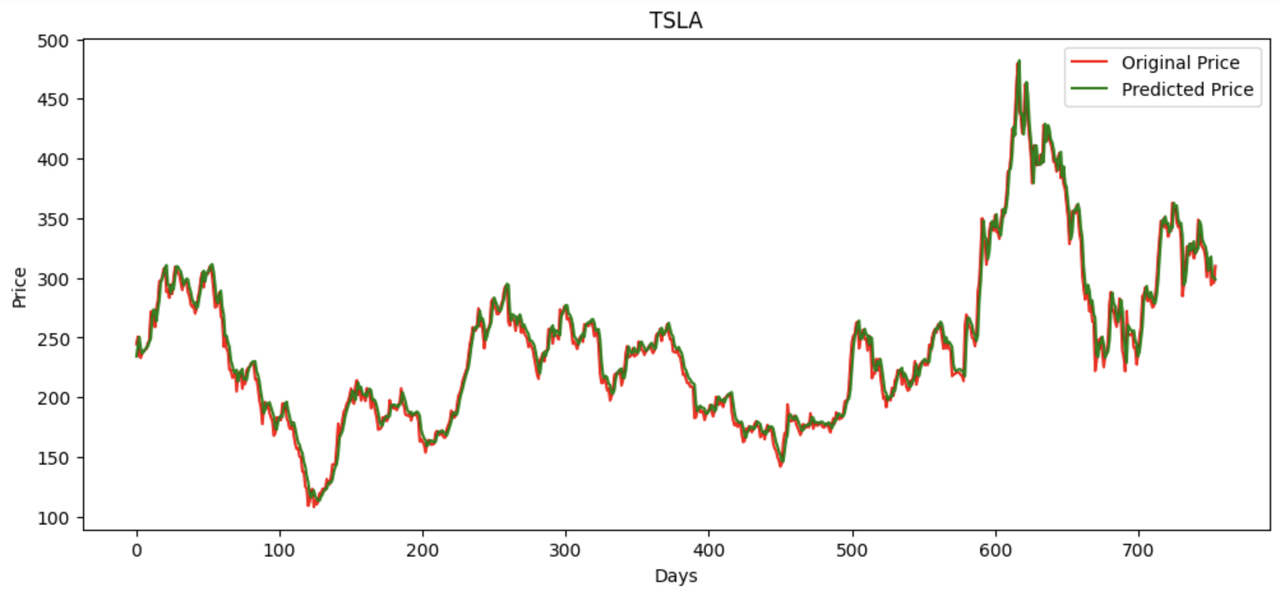
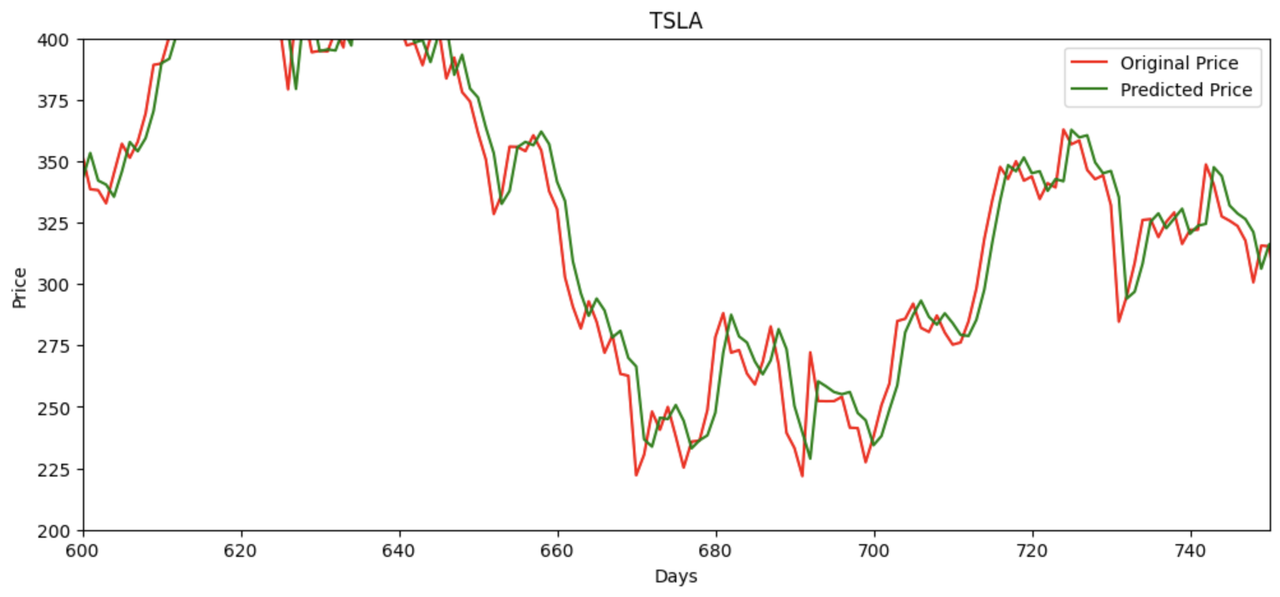
- Plotted predicted vs actual prices for comparison.
- Calculated Mean Squared Error (MSE) to measure average squared prediction error.
- Calculated Root Mean Squared Error (RMSE) for interpretable error units.
- Calculated R² Score to measure the proportion of variance explained by the model.