Explain your 🤗 transformers without effort!
![]()


Transformers visualizer is a python package designed to work with the 🤗 transformers package. Given a model and a tokenizer, this package supports multiple ways to explain your model by plotting its internal behavior.
This package is mostly based on the Captum tutorials [1] [2].
pip install transformers-visualizerLet's define a model, a tokenizer and a text input for the following examples.
from transformers import AutoModel, AutoTokenizer

model_name = "bert-base-uncased"
model = AutoModel.from_pretrained(model_name)
tokenizer = AutoTokenizer.from_pretrained(model_name)
text = "The dominant sequence transduction models are based on complex recurrent or convolutional neural networks that include an encoder and a decoder."Attention matrices of a specific layer
from transformers_visualizer import TokenToTokenAttentions

visualizer = TokenToTokenAttentions(model, tokenizer)
visualizer(text)
Instead of using __call__ function, you can use the compute method. Both work in place, compute method allows chaining method.
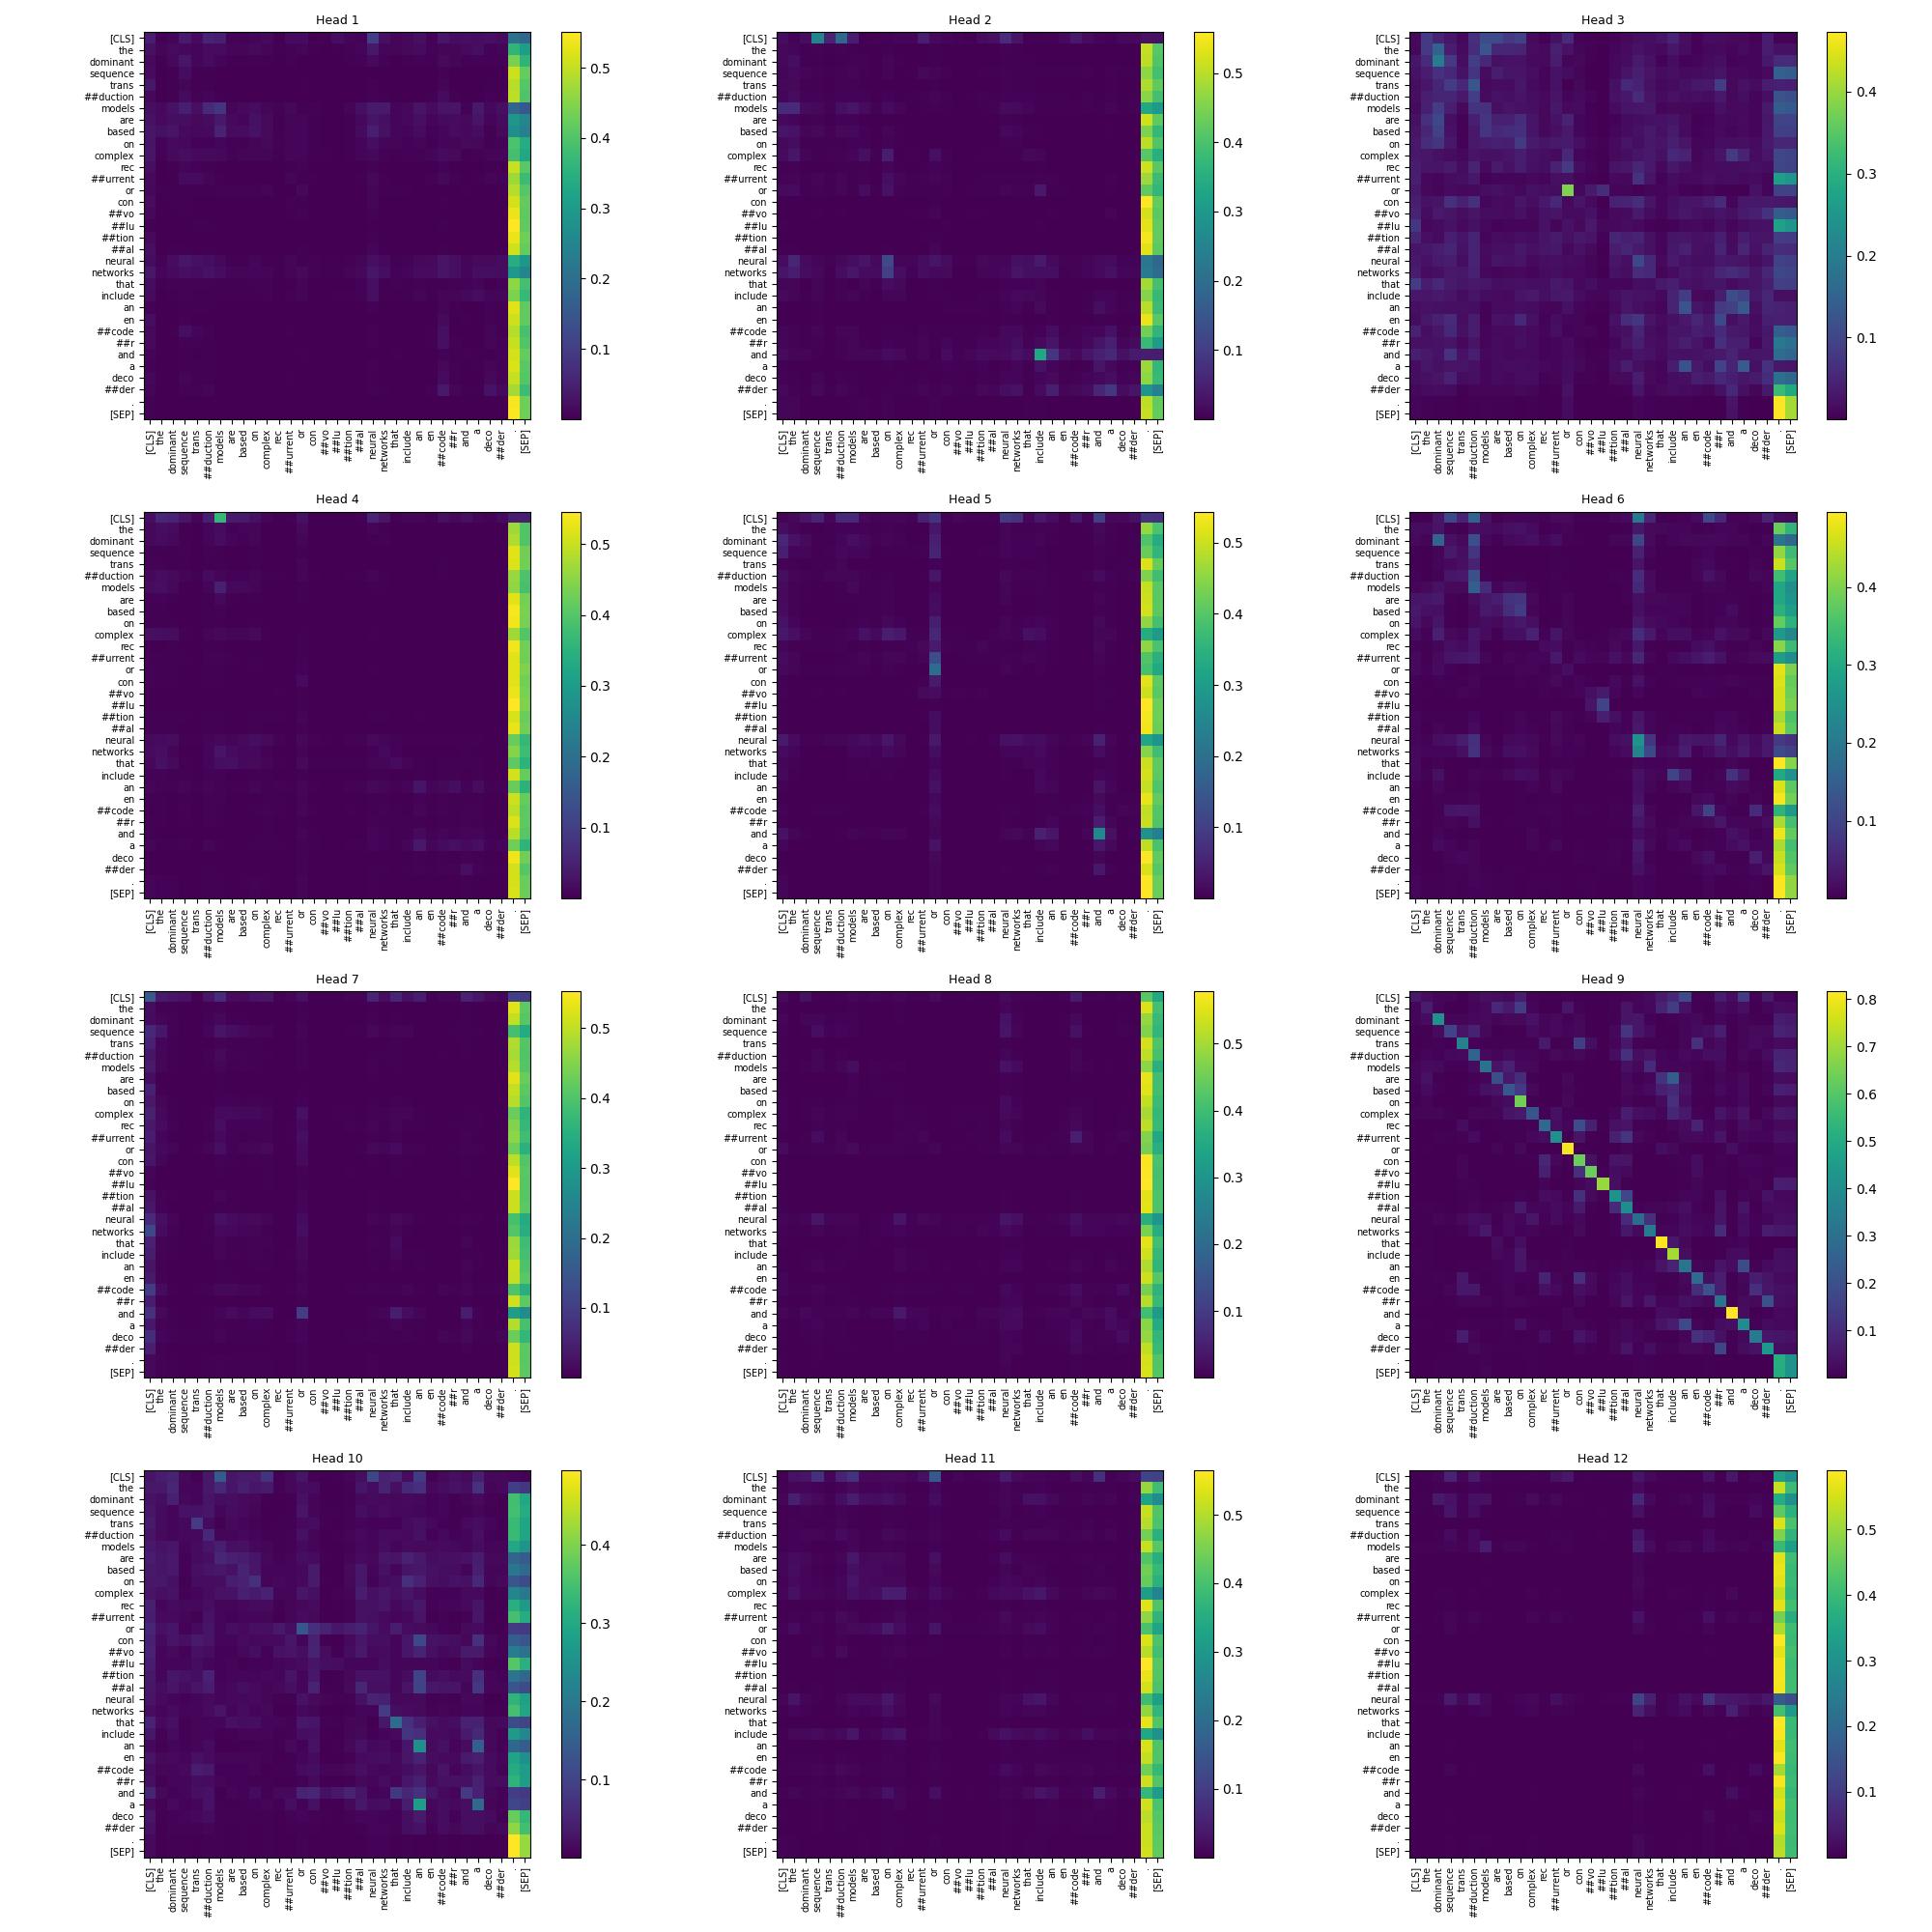
plot method accept a layer index as parameter to specify which part of your model you want to plot. By default, the last layer is plotted.
import matplotlib.pyplot as plt

visualizer.plot(layer_index = 6)
plt.savefig("token_to_token.jpg")
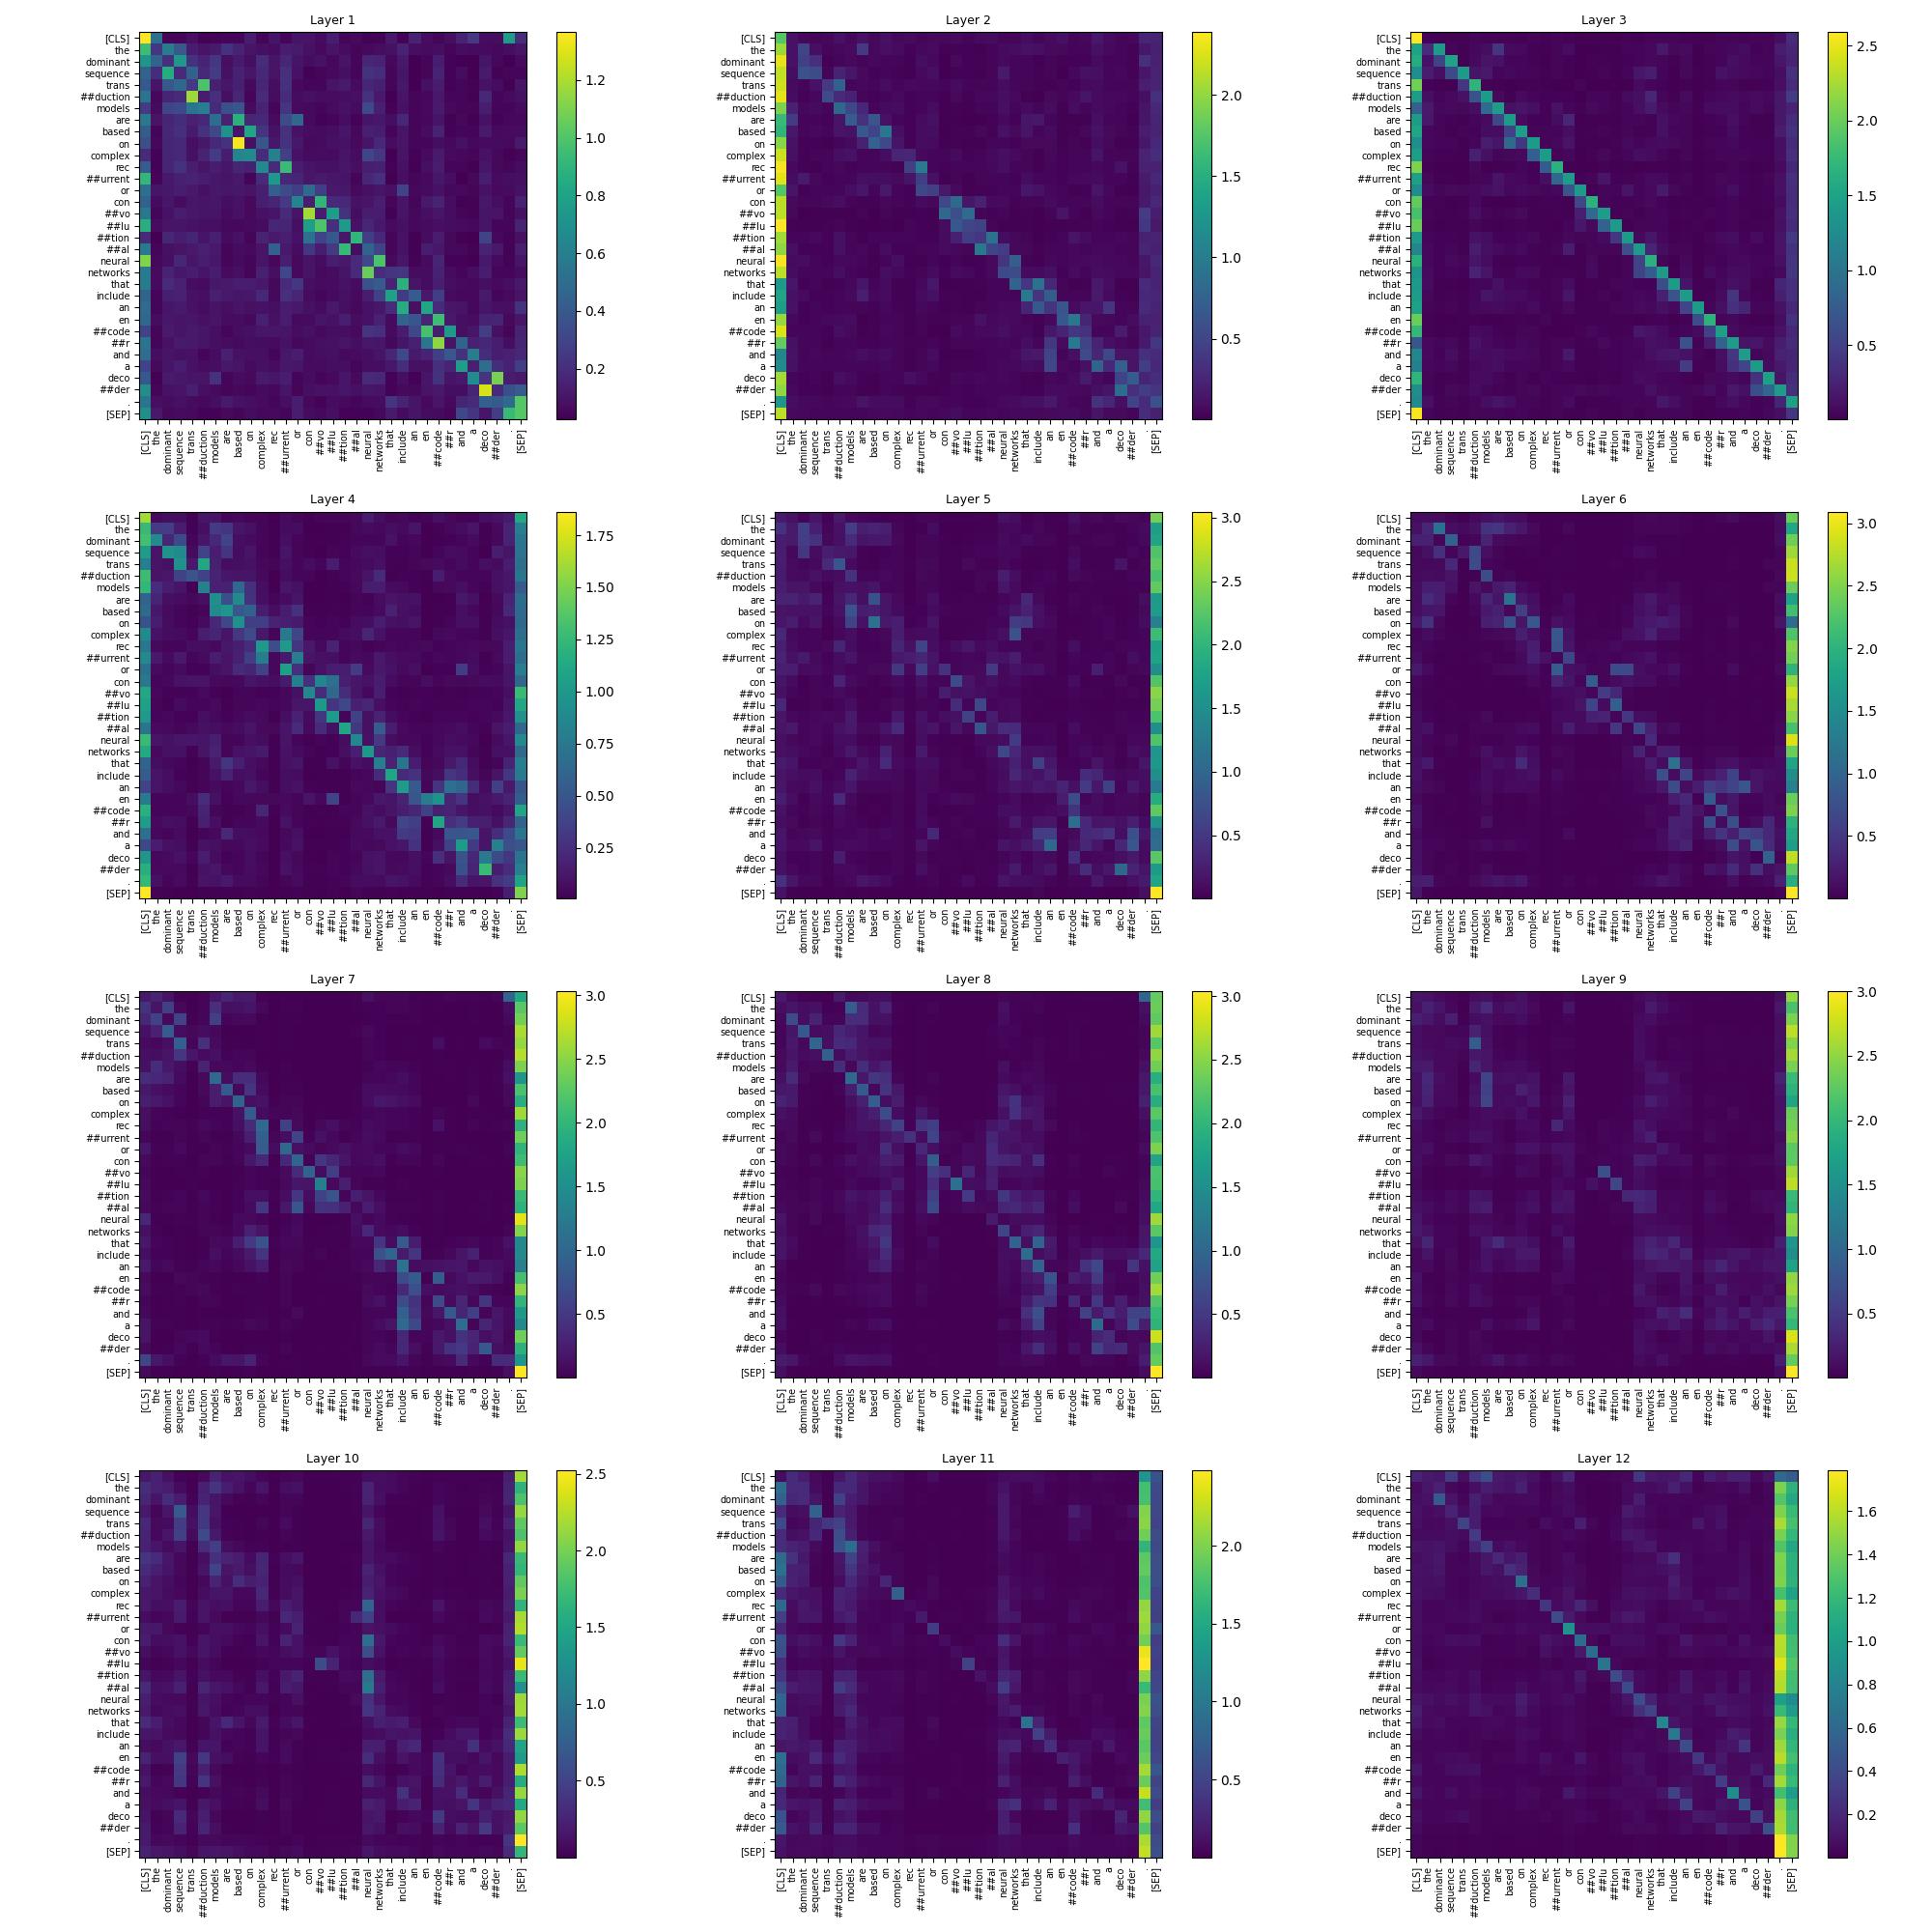
Attention matrices normalized across head axis
You can specify the order used in torch.linalg.norm in __call__ and compute methods. By default, an L2 norm is applied.
from transformers_visualizer import TokenToTokenNormalizedAttentions

visualizer = TokenToTokenNormalizedAttentions(model, tokenizer)
visualizer.compute(text).plot()
plot method accept to skip special tokens with the parameter skip_special_tokens, by default it's set to False.
You can use the following imports to use plotting functions directly.
from transformers_visualizer.plotting import plot_token_to_token, plot_token_to_token_specific_dimensionThese functions or the plot method of a visualizer can use the following parameters.
figsize (Tuple[int, int]): Figsize of the plot. Defaults to (20, 20).ticks_fontsize (int): Ticks fontsize. Defaults to 7.title_fontsize (int): Title fontsize. Defaults to 9.cmap (str): Colormap. Defaults to "viridis".colorbar (bool): Display colorbars. Defaults to True.
- Add an option to mask special tokens.
- Add an option to specify head/layer indices to plot.
- Add other plotting backends such as Plotly, Bokeh, Altair.
- Implement other visualizers such as vector norm.
- Transformers Interpret for the idea of this project.