This tool is a Python rendition of the Java-based tool Motviz1[1] published in 2011. MotvizPy uses Shannon Entropy at its core to calculate conservation from a MSA file generated from PSI-BLAST searches of the reference protein database. The Shannon Entropy part of the algorithm is novel, an improvement on the earlier version of the tool.
The Java-based tool only used the * on a given vertical position in the alignment file to infer conservation and use that as a basis for conservation. This tool introduces information theory and statistics to infer probabilitistically the regions of amino acids sequences that show conservation. Shannon Entropy is known[2] to be a good measure for conservation. This cuts down on the large number of false positive results observed in the earlier tool.
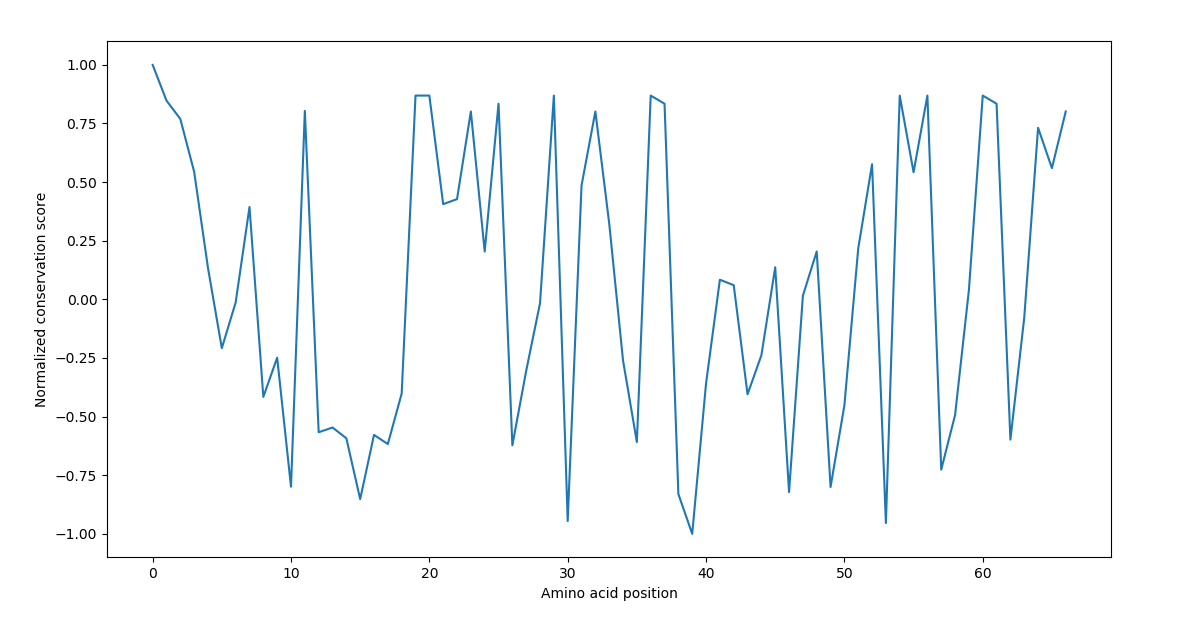
After calculating the normalized data, a graph like the following is generated:
Here is the workflow for the tool:
-
Pass the PDB ID for a structure on the terminal
-
Use that PDB ID to retrieve both the structure and sequence and write the two in a specified directory.
-
Take the sequence file and run a PSI-BLAST search on the refseq_protein.00 NCBI database present locally on the computer. The output file is an XML file.
-
The XML file is parsed and then turned into a FASTA file ready to be run through a Clustal Omega multiple sequence alignment.
-
Here is the step that is novel in this tool: I introduce information theory into the algorithm. All the sequences are taken into a 2d list, which is then converted to a numpy array. From there, Shannon Entropy scores are calculated vertically for each amino acid posiition. Then the data is normalized between -1 and 1. Local minima are found such that the value is less than the mean of the distribution. I ten isolate stretches of sequences that continuously have values less than 1/4th of mean value.
This is then proposed as a potential motif. And passed as return value.
-
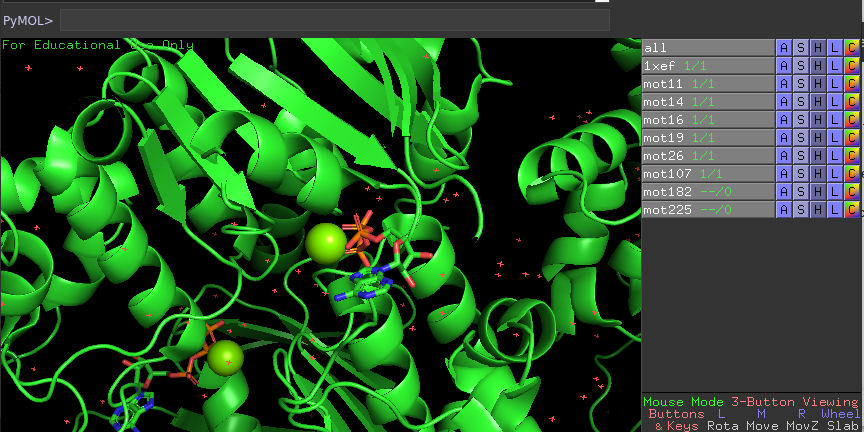
Finally, the positions are written on txt file to be then executed on PyMol. When When run on PyMol, the script will automatically fetch the PDB file and highlight the regions of interest in red, as is shown as follows:
Footnotes:
[1]. https://www.ncbi.nlm.nih.gov/pmc/articles/PMC5054496/
[2]. https://www.sciencedirect.com/science/article/pii/S1567134811003236
This project will be further developed in the future and will hopefully be in Rust or C++.