TerminalTelemetry is a modern, cyberpunk-inspired terminal emulator and network telemetry platform built with PyQt6. It combines powerful SSH terminal capabilities with real-time network device monitoring in a sleek, themeable interface.
TerminalTelemetry is a native desktop application - requires a graphical desktop environment (not for headless servers or web browsers).
TerminalTelemetry provides two launcher commands:
termtel- Standard GUI launch (Windows:termtel.exe)termtel-con- Launch with console output (for debugging and troubleshooting)
Windows & macOS:
pip install TerminalTelemetry
termtel
Linux & WSL2:
sudo apt install -y libqt6gui6t64 libqt6widgets6t64 libqt6core6t64 qt6-base-dev \
    libxcb-cursor0 libxcb-icccm4 libxcb-image0 libxcb-keysyms1 libxcb-randr0 \
    libxcb-render-util0 libxcb-xinerama0 libxcb-xkb1 libxkbcommon-x11-0 \
    libxcb-shape0 libxcb-shm0 libxcb-sync1 libxcb-xfixes0 libx11-xcb1 libgl1 libglib2.0-0t64

pip install TerminalTelemetry
termtel
📘 For other Linux distributions, WSL2 setup, and troubleshooting: Linux Installation Guide
Looking for a web-based tool? See Velociterm instead.
- 24+ built-in themes (Cyberpunk, Nord, Gruvbox, Doom, Borland, Amiga, CRT-Green/Amber, and more)
- Dynamic JSON-based themes with hot-reload capability
- Live theme switching across all components without restart
- Per-tab theme customization via right-click context menu
- Individual terminal theming - different theme for each tab
- Theme editor with real-time preview and custom theme creation
- Consistent theming across terminals, telemetry widgets, and UI components
- Tab management with rename functionality and clean context menus
- Tabbed SSH terminals with xterm.js backend
- Session management with YAML-based configuration
- Per-tab customization - individual themes and renamed tab labels
- Context menu controls - close, rename, and theme individual tabs
- Quick Connect interface for rapid device access
- Cross-platform terminal support (Windows, macOS, Linux)
- Live device monitoring via SSH (no SNMP required)
- Multi-vendor support (Cisco IOS/IOS-XE/NX-OS, Arista EOS, Linux)
- Real-time data collection:
- System information (hostname, version, uptime, hardware)
- CPU and memory utilization with progress bars
- CDP/LLDP neighbor discovery
- ARP table monitoring
- Routing table with VRF support
- Live system log streaming
- Threaded data collection keeps UI responsive
- Template-based parsing with 200+ TextFSM templates
- CSV export for all telemetry data tables
- Built-in template editor with syntax highlighting
- 200+ pre-configured TextFSM templates for network devices
- Live template testing against real device output
- Field mapping validation with coverage reports
- Template debugging with detailed error reporting
- Package resource management - templates included in installation
- Encrypted credential storage with Fernet (AES-128-CBC) + HMAC
- PBKDF2-HMAC-SHA256 key derivation (480,000 iterations)
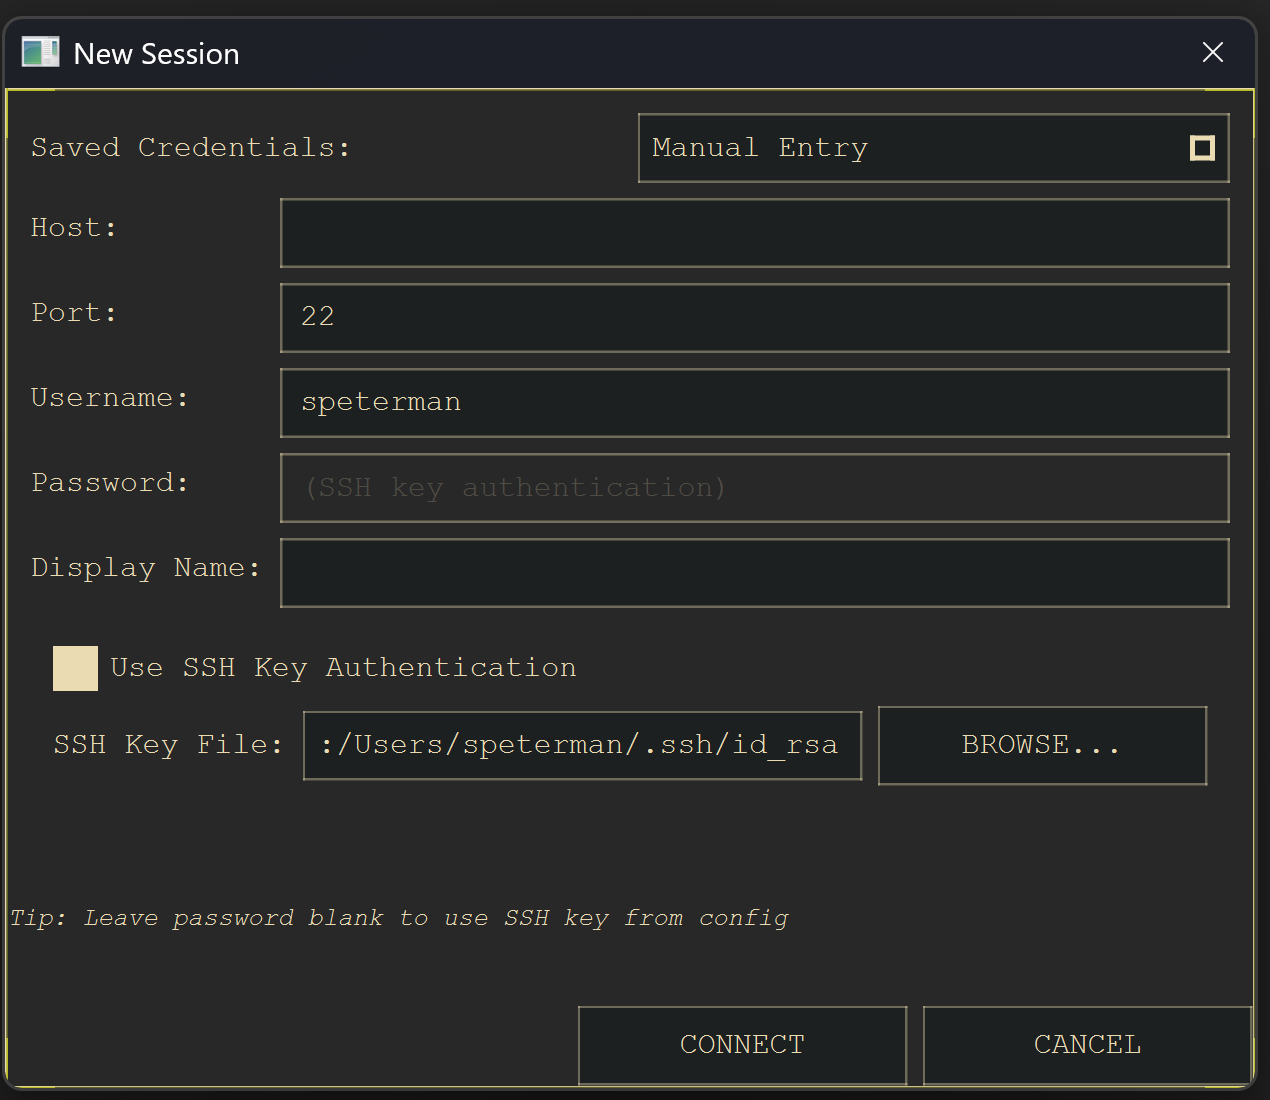
- SSH key authentication 🆕
- Automatic private key detection from
~/.ssh/ - Support for RSA, ED25519, ECDSA, DSS key types
- Config-based key management (
~/.ssh_manager/keys.json) - Per-session key preferences with persistent settings
- Automatic private key detection from
- Platform-specific secure storage locations
- Machine-specific credential binding
- Rate-limited authentication prevents brute force
- Zero plaintext storage of sensitive data
- NetBox Integration:
- Import devices directly from NetBox instances
- Site-based organization and grouping
- Automatic credential mapping
- LogicMonitor Integration:
- SDK-based device discovery
- Progress feedback and error handling
- SSL certificate validation support
- Text Editor with syntax highlighting
- Diff Tool for configuration comparison
- Serial Terminal for console connections
- Space Debris & Doom - Demonstrates the framework's capability as a general-purpose tool delivery platform. The terminal application's architecture is designed to host any PyQt6 or web-based component, making it easy to extend with custom tools and utilities.
- Works with any SSH-accessible device
- No agent installation required on target devices
- Leverages existing SSH credentials
- Zero infrastructure - no monitoring servers or databases needed
- 200+ TextFSM templates packaged with the application
- Live template editing with syntax highlighting and testing
- Field normalization across different vendors
- Package resource system - templates accessible in any environment
- User-customizable - fix parsing issues yourself
- Qt6-based UI with native performance
- Threaded data collection prevents UI blocking
- Signal-based communication between components
- Modular widget system - easily add new tools and features
- Package-aware resource management for pip installations
- Tab-based interface can host any PyQt6 widget or web content
- Install via pip:
pip install TerminalTelemetry - Launch:
termtel - Create SSH sessions via File → Open Sessions or use Quick Connect
- Open Telemetry Dashboard via Tools → Telemetry Dashboard
- Connect to devices and view real-time monitoring data
- Customize themes via View → Theme menu and Theme Editor
Note for Windows users: After installation, you can create a desktop shortcut to venv\Scripts\termtel.exe for easier access.
- Click "Quick Connect" in the bottom panel
- Enter device IP, credentials, and select platform (cisco_ios, arista_eos, etc.)
- Click "Connect" - terminal tab opens automatically
- Open Tools → Telemetry Dashboard to see real-time monitoring
- Use the gear buttons in widgets to customize TextFSM templates
- Global themes: Use View → Theme menu to change all components
- Individual tab themes: Right-click any tab label → Terminal Theme → select theme
- Custom themes: Use View → Theme → Theme Editor to create new themes
- Theme files: Drop JSON theme files in the
~/.termtel/themes/directory for instant availability
- Connect to a device and open telemetry dashboard
- Click the ⚙️ gear button on any widget (neighbors, routes, etc.)
- Template editor opens with current template and sample data
- Edit template using TextFSM syntax
- Click "RUN TEST" to validate against live device output
- Save template - changes apply immediately
- Cisco IOS/IOS-XE: System info, CDP neighbors, ARP table, routing table, CPU/memory utilization, system logs, VRF support
- Cisco NX-OS: System info, CDP neighbors, ARP table, routing table, VRF support (missing CPU/memory/logs)
- Arista EOS: System info, LLDP neighbors, ARP table, routing table, CPU/memory, temperature, logs, VRF support (uses LLDP instead of CDP)
- Aruba AOS-S/CX: System info, LLDP neighbors, ARP table, routing table (missing CPU/memory/logs)
- HP ProCurve: System info, LLDP neighbors, ARP table, routing table (legacy switch support)
- Juniper JunOS: System info, LLDP neighbors, ARP table (minimal support)
- Linux: System info, ARP table, routing table (basic networking commands)
Based on your actual TextFSM template library:
- 200+ templates total across all vendors
- Cisco IOS: 100+ templates (most comprehensive)
- Arista EOS: 45+ templates (good coverage)
- Cisco NX-OS: 15+ templates (basic coverage)
- HP ProCurve: 7 templates (legacy support)
- Juniper JunOS: 3 templates (minimal)
- Linux: Basic networking templates
- Aruba: Basic switch templates
- Cisco NX-OS: Missing CPU/memory utilization and system log templates
- Aruba platforms: No CPU/memory monitoring templates available
- HP ProCurve: Legacy platform with limited template coverage
- Juniper JunOS: Minimal template support (contributions welcome)
- Linux: Basic networking only (no system monitoring templates)
- Cisco IOS/IOS-XE has the most comprehensive template coverage
- Arista EOS has good coverage but uses LLDP instead of CDP for neighbors
- Other platforms have basic connectivity but may lack advanced telemetry features
- Missing templates can be created using the built-in template editor
- Single-device monitoring per telemetry tab (multi-device dashboard planned)
- No historical data storage (trending features planned)
- Template editor requires platform connection for live testing
- Multi-device dashboards for network-wide monitoring
- Historical data collection with basic trending graphs
- Enhanced error handling and automatic reconnection
- Template sharing and import/export functionality
- Custom command execution with ad-hoc template creation
- Network topology discovery and visualization
- Configuration backup and change detection
- Alert system for threshold monitoring
- Plugin architecture for community extensions
- REST API for external integrations
- Distributed monitoring across multiple instances
- Community template repository with automatic updates
- Advanced analytics and machine learning insights
- Mobile companion app for alerts and basic monitoring
SSH Connection → Command Execution → TextFSM Parsing → Field Normalization → UI Display
     ↓                ↓                    ↓                   ↓              ↓
 netmiko         show commands      Package Templates    Platform Maps    PyQt6 Widgets
- Resource Manager: Package-aware template and config loading
- Platform Config Manager: JSON-driven platform definitions
- Threaded Telemetry Controller: Non-blocking data collection
- Template Editor: Live template editing and testing
- Theme System: JSON-based UI customization
- Modular Tab System: Extensible framework for hosting custom tools and widgets
- Credential encryption using Fernet with PBKDF2 key derivation
- SSH key authentication with automatic key detection
- No network exposure - purely SSH client connections
- Local data storage with machine-specific encryption keys
- Memory-safe credential handling with automatic cleanup
Found an issue? Please report it with:
- Device platform and software version
- Command output that failed to parse
- Steps to reproduce the issue
- Expected vs actual behavior
- Use the built-in template editor to create/fix templates
- Test against multiple software versions when possible
- Follow TextFSM best practices for field naming
- Submit templates for new platforms or commands
git clone https://github.com/scottpeterman/terminaltelemetry.git
cd terminaltelemetry
pip install -e .
# Edit code, templates, themes
python -m pytest tests/ # Run testsTerminal sessions alongside real-time telemetry monitoring
Live monitoring of Cisco devices showing neighbors, ARP, routing, and system metrics
Real-time template customization with live preview
TerminalTelemetry is licensed under the GPLv3 License. See the LICENSE file for details.
- Built on PyQt6 and the Python ecosystem
- Network automation powered by netmiko and TextFSM
- Terminal functionality via xterm.js
- Template system inspired by ntc-templates
- Packaging system using modern Python setuptools
- Inspired by cyberpunk aesthetics and retro computing
- GitHub Issues: Bug reports and feature requests
- GitHub Repository: https://github.com/scottpeterman/terminaltelemetry
- Documentation: Comprehensive guides and API reference
- Template Library: Community-contributed TextFSM templates
- ✅ SSH key authentication - Passwordless authentication with auto-detection
- ✅ 24+ themes - Expanded theme library with vintage and retro options
- ✅ Package resource system - pip installable with embedded templates
- ✅ Template editor integration - live editing and testing
- ✅ CSV export functionality for all telemetry tables
- ✅ Enhanced platform support with JSON configuration
- ✅ Threaded telemetry collection for responsive UI
- ✅ Improved error handling and connection management
"The best network monitoring tool is the one that gets out of your way and shows you what you need to know."