


pip install backtrader-next
Package is based on backtrader
Changes:
- Added new Chart plotting using bn-lightweight-charts-python.
- Improved testing performance by using the
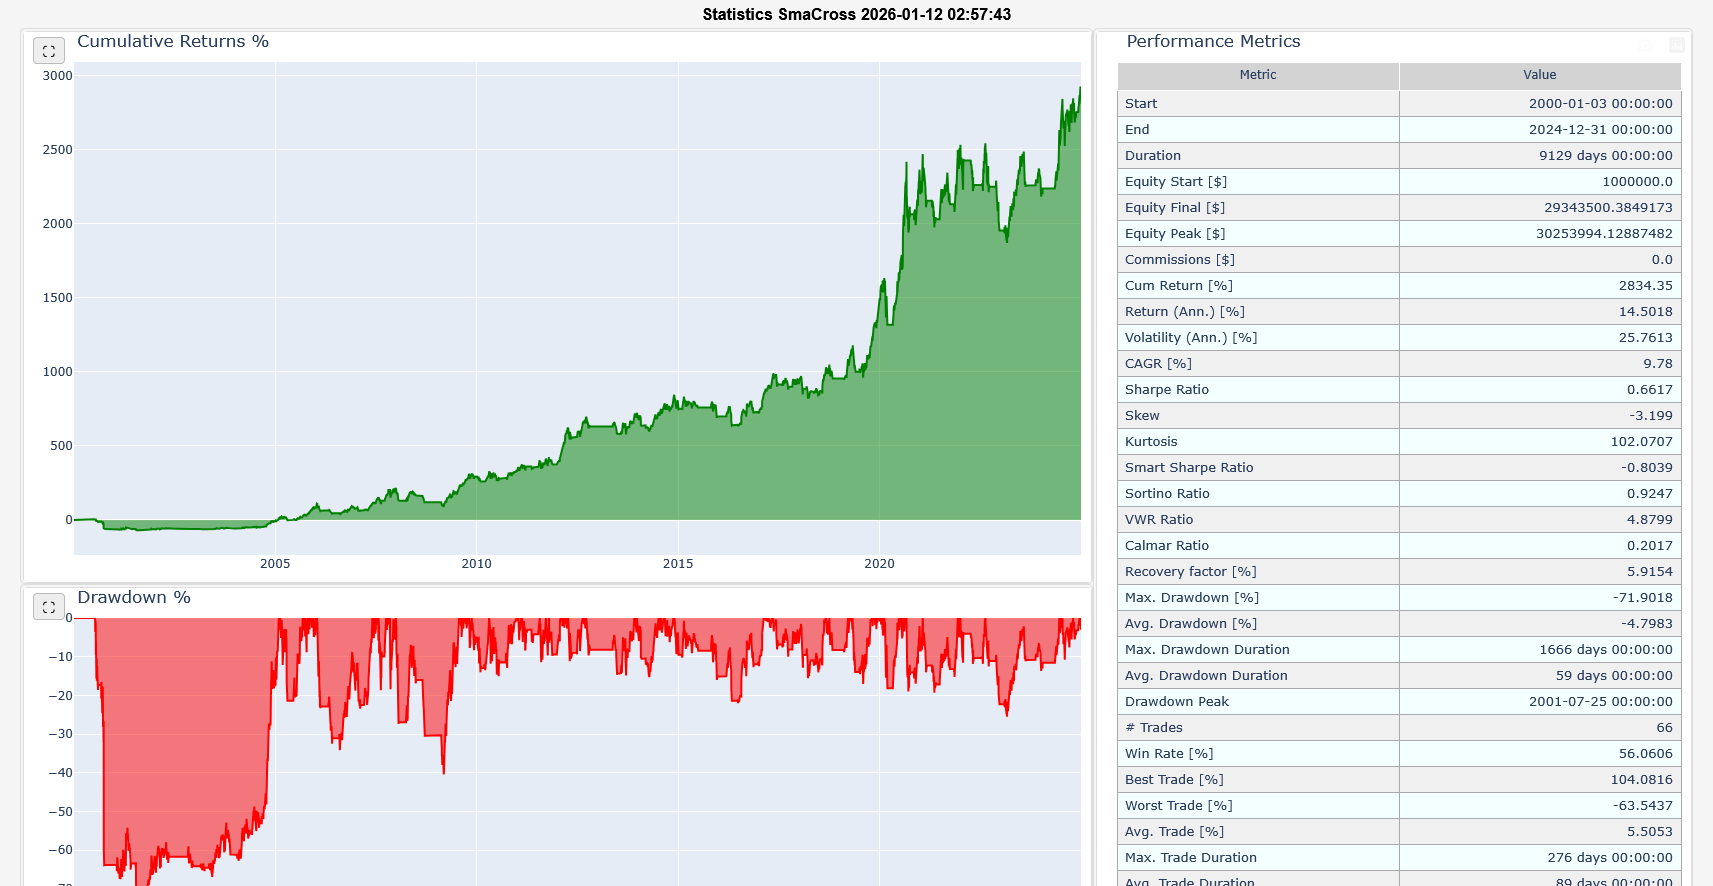
PandasDatafeed inrunonce=Truemode. - Added performance statistics in both text format (similar to Backtesting.py) and HTML format (similar to Quantstats).
- Improved support for switching between futures (for testing, etc.).
- Added new indicators implemented with Numba.
- Improved performance — now it runs about 2–3× slower than Backtesting.py in
runonce=Truemode withPandasData. - Detailed results
- Interactive visualizations
import pandas as pd
import backtrader_next as bt
from backtrader_next.feeds import PandasData


class SimpleSizer(bt.Sizer):
    params = (
        ('percents', 99),
    )

    def _getsizing(self, comminfo, cash, data, isbuy):
        value = self.broker.getvalue()
        price = data.close[0]+comminfo.p.commission
        size = value / price * (self.params.percents / 100)
        return int(size)


class SmaCross(bt.Strategy):
    params = (
        ('MA1', 20),
        ('MA2', 50),
    )

    def __init__(self):
        self.Order = None
        self.ma1 = bt.nind.SMA(self.data.close, period=self.params.MA1)
        self.ma2 = bt.nind.SMA(self.data.close, period=self.params.MA2)


    def notify_order(self, order):
        if order.status in [order.Submitted, order.Accepted]:  # Order is submitted/accepted
            return  # Do nothing until the order is completed

        elif order.status in [order.Canceled, order.Margin, order.Rejected]:  # Canceled, Margin, Rejected
            print('Order was Canceled/Margin/Rejected')

        self.Order = None  # Reset order


    def next(self):
        # Use ONLY Long Positions
        if self.crossover(self.ma1, self.ma2):
            pos = self.getposition()
            if pos:
                self.close(size=pos.size)
            self.Order = self.buy()
        elif self.crossover(self.ma2, self.ma1):
            pos = self.getposition()
            if pos:
                self.close(size=pos.size)
            # self.Order = self.sell()

    def crossover(self, ma1, ma2):
        try:
            return ma1[-1] <= ma2[-1] and ma1[0] > ma2[0]
        except IndexError:
            return False


if __name__ == '__main__':
    cerebro = bt.Cerebro()
    cerebro.broker.setcash(1_000_000.0)
    cerebro.broker.set_shortcash(False)
    cerebro.broker.setcommission(commission=0, margin=1, mult=1)
    cerebro.addsizer(SimpleSizer, percents=90)

    df = pd.read_csv(f"AAPL_1d.csv.zip", sep=";")
    df['Datetime'] = pd.to_datetime(df['Date'].astype(str) , format='%Y-%m-%d')
    df.set_index('Datetime', inplace=True)

    data = PandasData(dataframe=df, timeframe=bt.TimeFrame.Days, compression=1)
    cerebro.adddata(data, name='AAPL')

    cerebro.addstrategy(SmaCross, )

    print(f'Starting Portfolio Value: {cerebro.broker.getvalue():.2f}\n')
    results = cerebro.run()
    print(f'\nFinal Portfolio Value: {cerebro.broker.getvalue():.2f}\n')

    rc = cerebro.statistics()
    print(rc)

    cerebro.plot(filename="smacross.html")
    cerebro.show_report(filename="smacross_stats.html")
print("end")Starting Portfolio Value: 1000000.00
Order was Canceled/Margin/Rejected
Order was Canceled/Margin/Rejected
Order was Canceled/Margin/Rejected
Order was Canceled/Margin/Rejected
Order was Canceled/Margin/Rejected
Order was Canceled/Margin/Rejected
Order was Canceled/Margin/Rejected
Order was Canceled/Margin/Rejected
Order was Canceled/Margin/Rejected
Order was Canceled/Margin/Rejected
Final Portfolio Value: 13125987.48
Strategy SmaCross
MA1 20
MA2 50
Start 2000-01-03 00:00:00
End 2024-12-31 00:00:00
Duration 9129 days 00:00:00
Equity Start [$] 1000000.0
Equity Final [$] 13125987.479046
Equity Peak [$] 13533263.280804
Commissions [$] 0.0
Cum Return [%] 1212.5987
Return (Ann.) [%] 10.8691
Volatility (Ann.) [%] 21.0469
CAGR [%] 7.3656
Sharpe Ratio 0.6044
Skew -6.1434
Kurtosis 219.8529
Smart Sharpe Ratio -1.7922
Sortino Ratio 0.812
VWR Ratio 3.6777
Calmar Ratio 0.1917
Recovery factor [%] 5.5986
Max. Drawdown [%] -56.6963
Avg. Drawdown [%] -4.674
Max. Drawdown Duration 2492 days 00:00:00
Avg. Drawdown Duration 69 days 00:00:00
Drawdown Peak 2000-10-03 00:00:00
# Trades 56
Win Rate [%] 55.3571
Best Trade [%] 92.0365
Worst Trade [%] -63.5437
Avg. Trade [%] 4.8655
Max. Trade Duration 276 days 00:00:00
Avg. Trade Duration 85 days 00:00:00
Profit Factor 1.1756
Expectancy [%] 0.0505
SQN 2.2935
Kelly Criterion [%] 37.6406
dtype: object
end
It will create two HTML files and open it in your current browser.
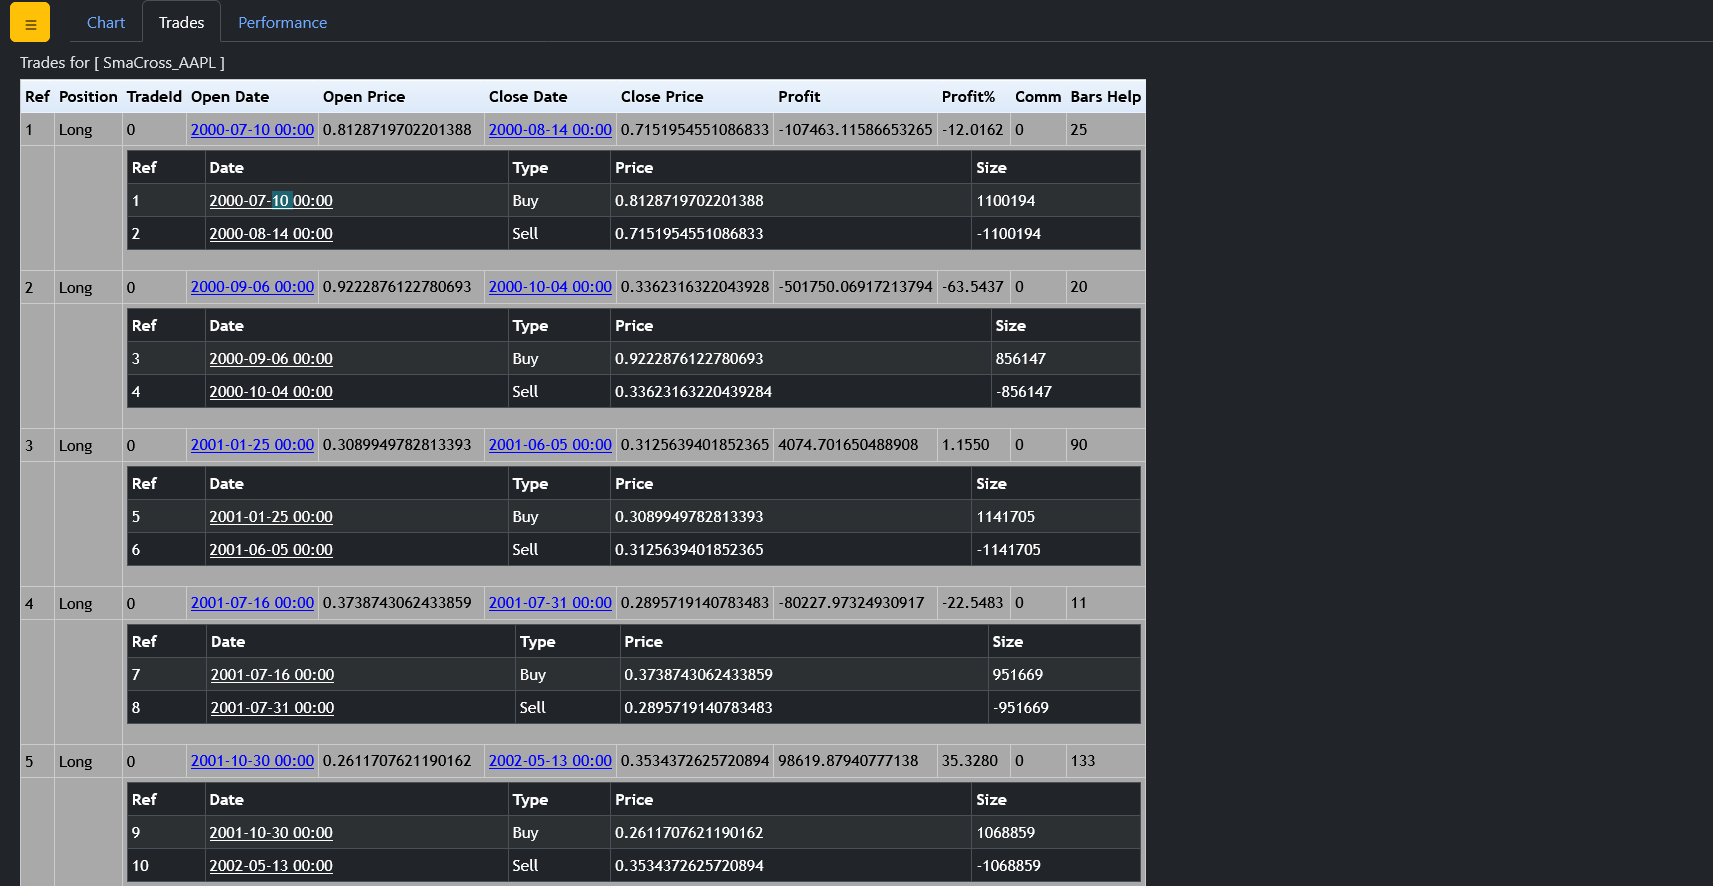
- smacross.html - charts and trade stats
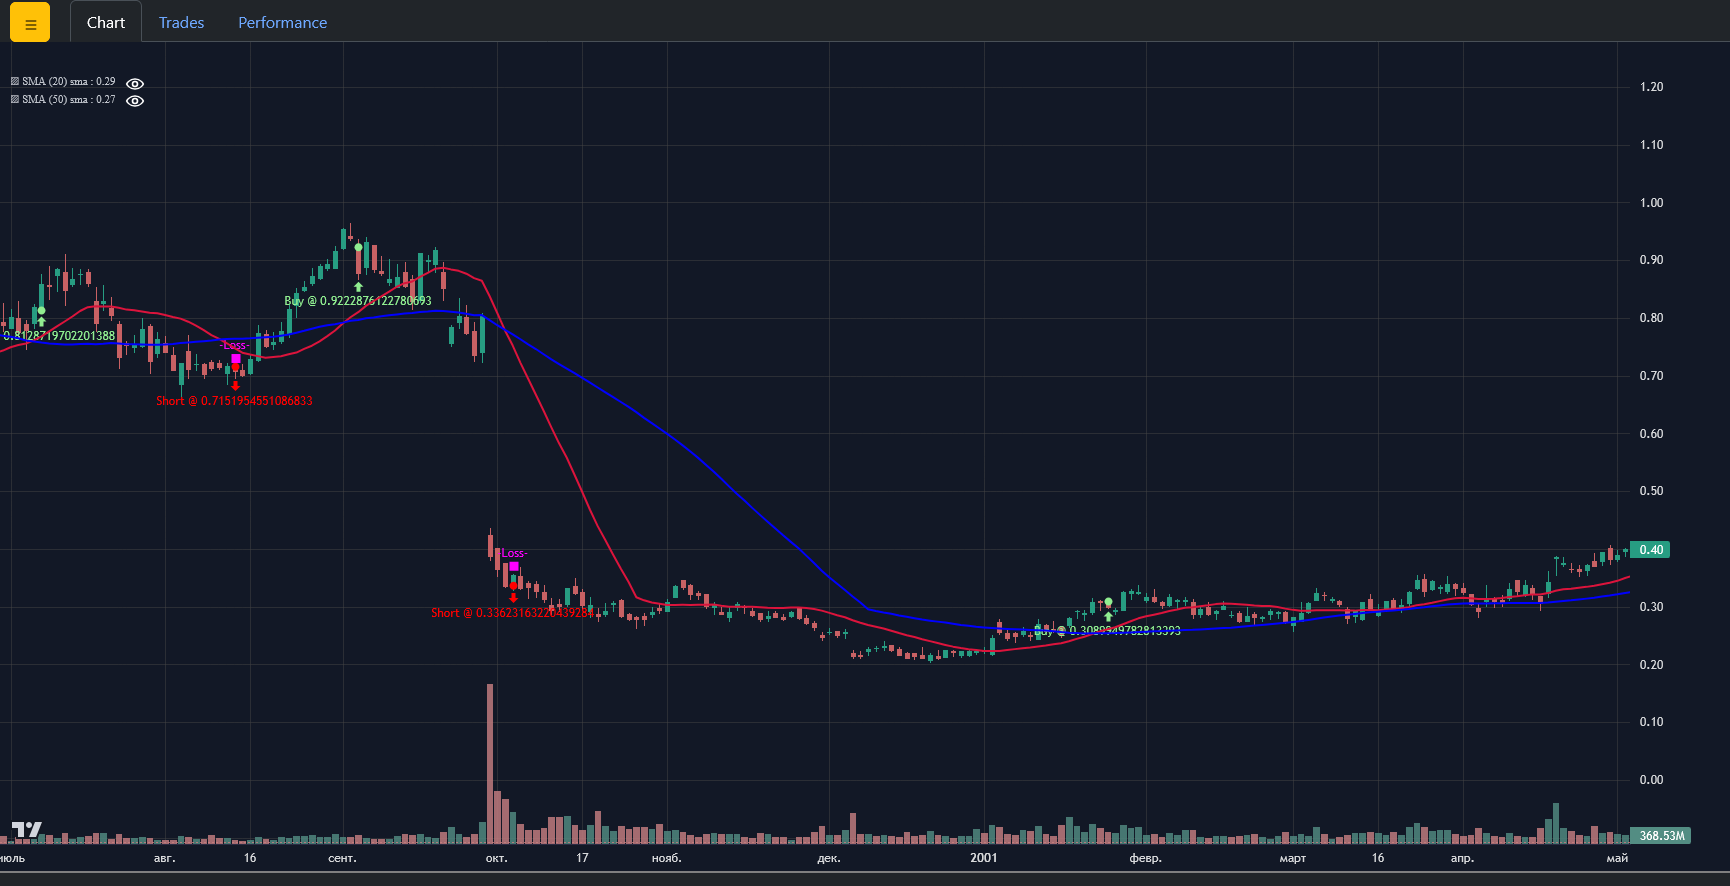
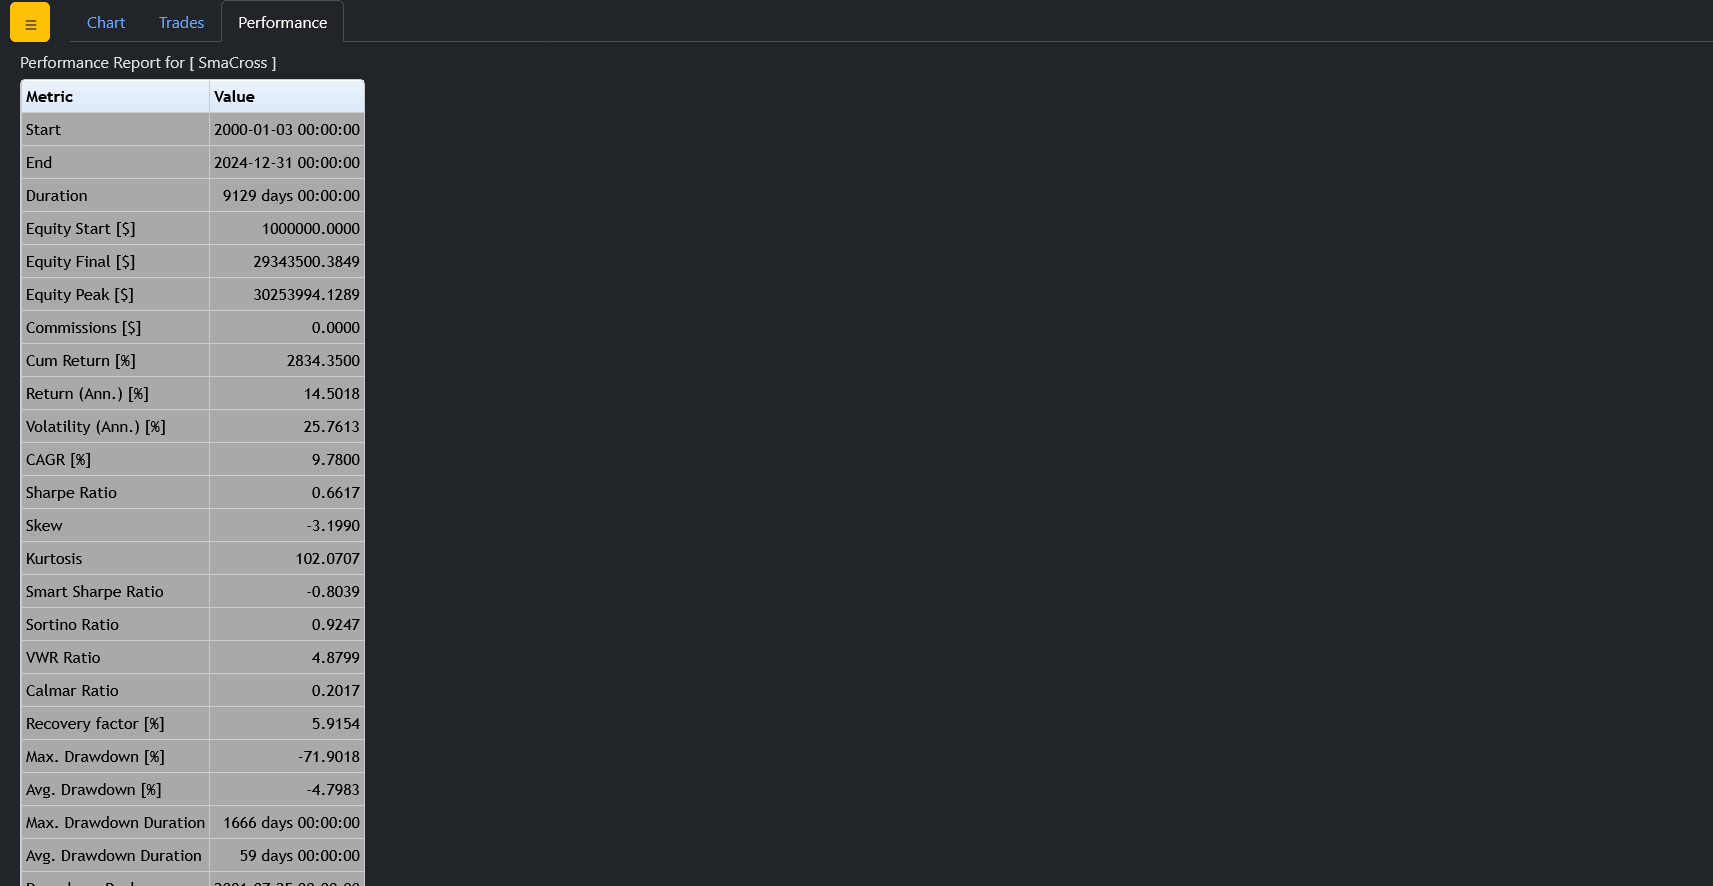
- smacross_stats.html - quantstats like strategy report
Live Trading and backtesting platform written in Python.
-
Live Data Feed and Trading with
- Interactive Brokers (needs
IbPyand benefits greatly from an installedpytz) - Visual Chart (needs a fork of
comtypesuntil a pull request is integrated in the release and benefits frompytz) - Oanda (needs
oandapy) (REST API Only - v20 did not support streaming when implemented)
- Interactive Brokers (needs
-
Data feeds from csv/files, online sources or from pandas and blaze
-
Filters for datas, like breaking a daily bar into chunks to simulate intraday or working with Renko bricks
-
Multiple data feeds and multiple strategies supported
-
Multiple timeframes at once
-
Integrated Resampling and Replaying
-
Step by Step backtesting or at once (except in the evaluation of the Strategy)
-
Integrated battery of indicators
-
TA-Lib indicator support (needs python ta-lib / check the docs)
-
Easy development of custom indicators
-
Analyzers (for example: TimeReturn, Sharpe Ratio, SQN) and
pyfoliointegration (deprecated) -
Flexible definition of commission schemes
-
Integrated broker simulation with Market, Close, Limit, Stop, StopLimit, StopTrail, StopTrailLimitand OCO orders, bracket order, slippage, volume filling strategies and continuous cash adjustmet for future-like instruments
-
Sizers for automated staking
-
Cheat-on-Close and Cheat-on-Open modes
-
Schedulers
-
Trading Calendars
-
Plotting (requires matplotlib)
The old blog for backtrader:
Blog <http://www.backtrader.com/blog>_
Read the full old documentation at:
Documentation <http://www.backtrader.com/docu>_
List of built-in Indicators (122)
Indicators Reference <http://www.backtrader.com/docu/indautoref.html>_
An example for IB Data Feeds/Trading:
-
IbPydoesn't seem to be in PyPi. Do either::pip install git+https://github.com/blampe/IbPy.git
or (if
gitis not available in your system)::pip install https://github.com/blampe/IbPy/archive/master.zip
For other functionalities like: Visual Chart, Oanda, TA-Lib, check
the dependencies in the documentation.
From source:
- Place the backtrader_next directory found in the sources inside your project
X.Y.Z
- X: Major version number. Should stay stable unless something big is changed
like an overhaul to use
numpy - Y: Minor version number. To be changed upon adding a complete new feature or (god forbids) an incompatible API change.
- Z: Revision version number. To be changed for documentation updates, small changes, small bug fixes